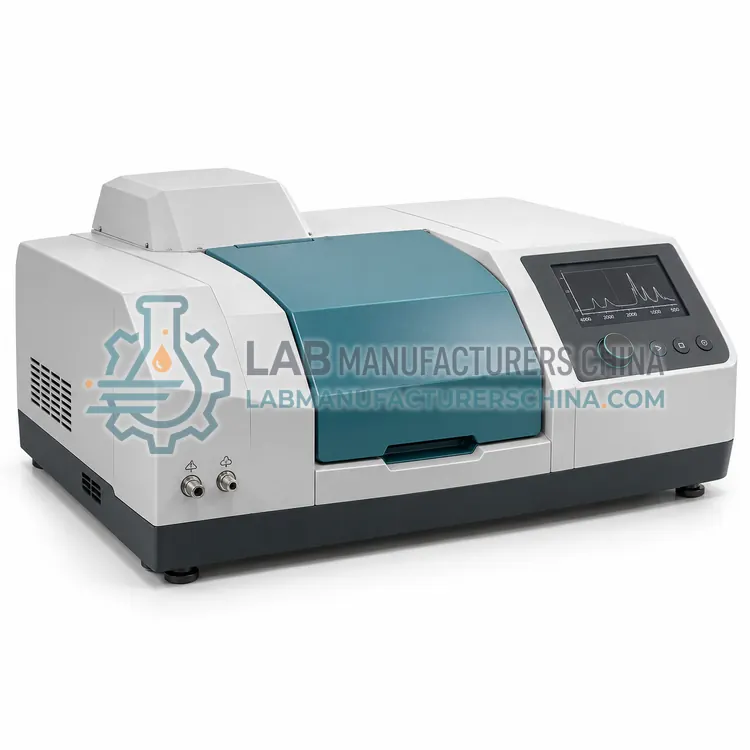
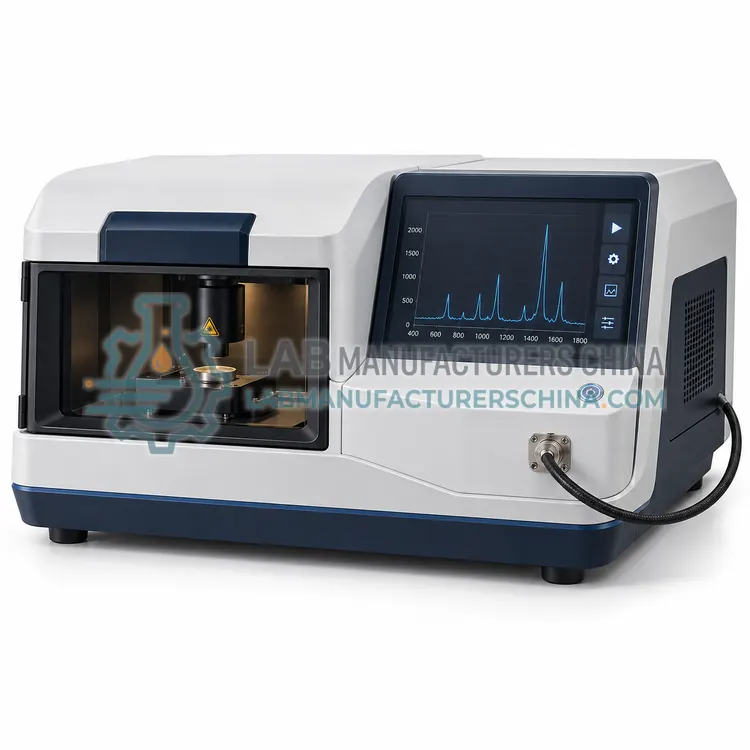
CCD Array Spectrometer
CCD 阵列光谱仪
- SKU SPC-0005
- Spectrometers
- CE (to be confirmed)
- ISO 9001 manufacturing (to be confirmed)
Price on request — FOB / CIF quoted per order
Prices depend on configuration, quantity and destination port.
Key specifications
| Wavelength range | 200–1100 nm |
|---|---|
| Detector | Linear CCD, 2048 pixels |
| Spectral resolution | 0.5–2 nm depending on slit |
| Integration time | 1 ms to 65 s |
| Optical bench | Crossed Czerny-Turner |
| Grating | 600 lines/mm |
Request a quote Download brochure · to be provided
By Lab Manufacturers China Technical TeamLast reviewed Standards: USP <857>, Ph. Eur. 2.2.25, ASTM E275
What is the CCD Array Spectrometer?
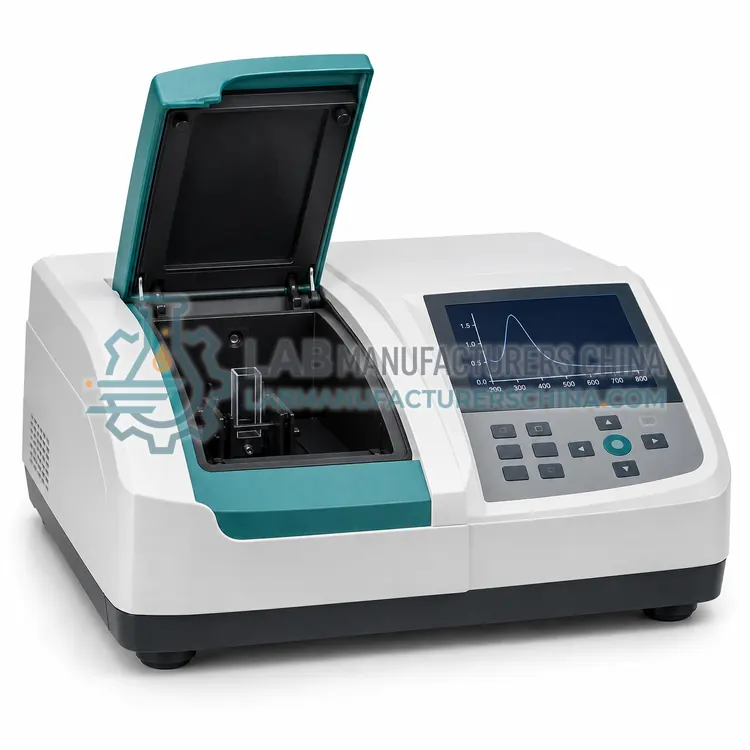
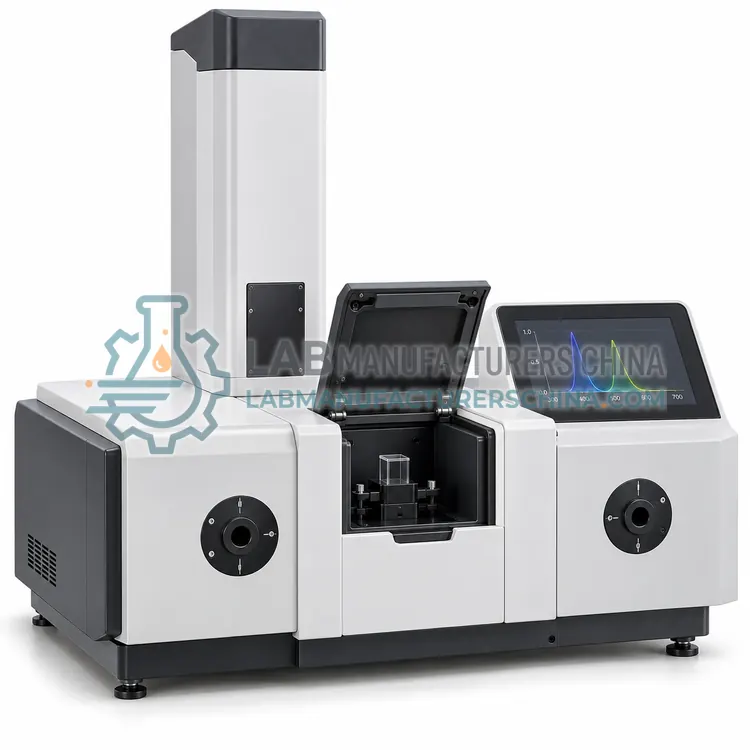
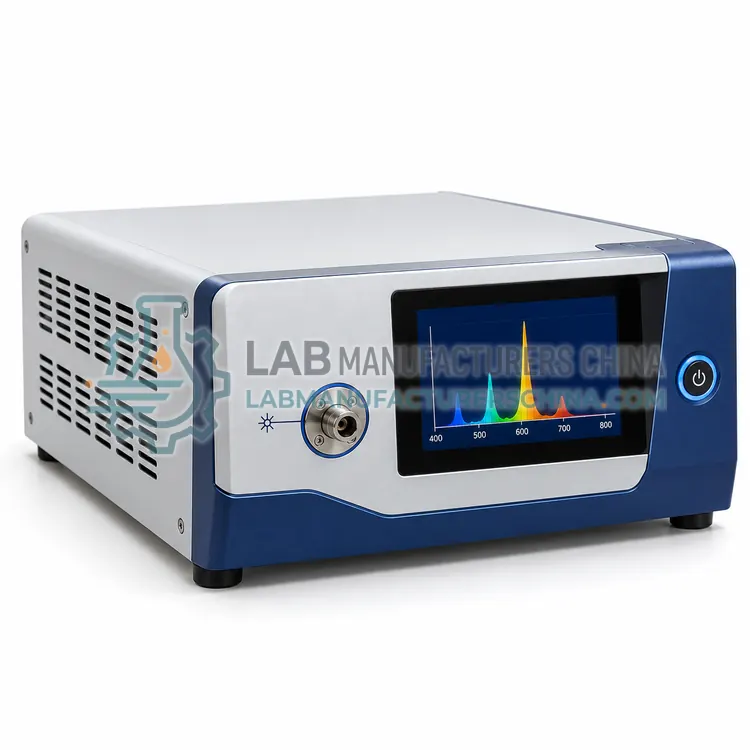
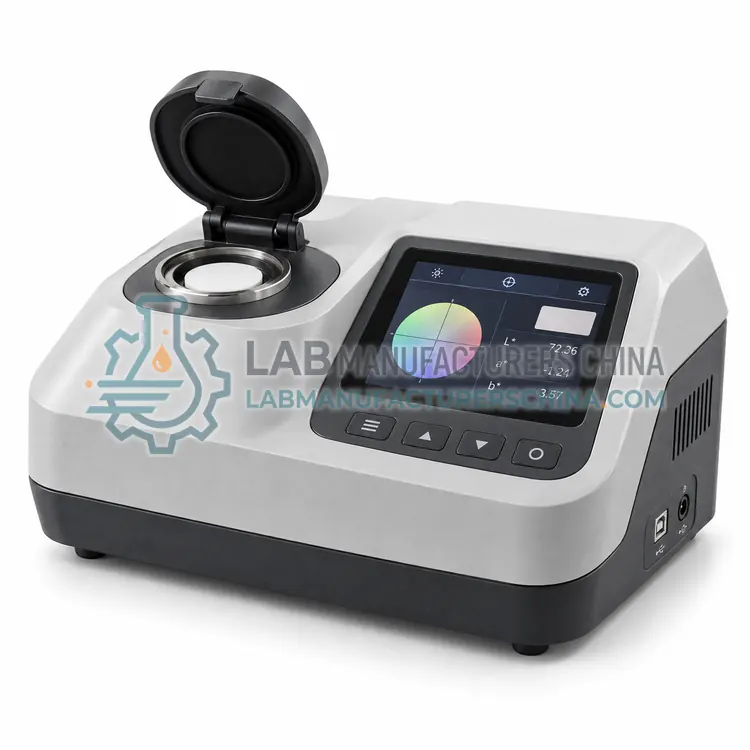
A CCD array spectrometer is a compact optical instrument that records a full spectrum simultaneously using a linear detector array. Its fast acquisition and small size suit inline monitoring, portable measurement and rapid colour or transmission checks.
What is the CCD Array Spectrometer?
A CCD array spectrometer is a compact optical instrument that records a full spectrum simultaneously using a linear detector array. Its fast acquisition and small size suit inline monitoring, portable measurement and rapid colour or transmission checks.
Overview
A CCD array spectrometer uses a fixed crossed Czerny-Turner or flat-field optical bench, usually with no moving parts. Light enters through a slit, is dispersed by a grating, and is projected onto a linear charge-coupled device or complementary metal-oxide semiconductor array that captures all wavelengths at once. Because no scanning is required, acquisition can be very fast and the instrument can be small and rugged. Resolution is set by slit width, grating and pixel size, and sensitivity by integration time and detector cooling. Fibre-optic coupling allows the instrument to be separated from the sampling point.
How does it work?
A spectrometer collects light from a source or sample and disperses it with a prism, diffraction grating or interferometer. The separated wavelengths fall on a detector, usually a photodiode, charge-coupled device or photomultiplier, which converts intensity into an electrical signal. The signal is digitized and plotted as intensity versus wavelength or wavenumber. Transmission, absorbance or emission bands reveal molecular or atomic structure, because specific groups absorb or emit at characteristic wavelengths. Optical resolution depends on slit width, grating groove density and detector pixel size, while sensitivity depends on source brightness, optical throughput and detector quantum efficiency. Wavelength calibration against emission lamps or reference standards keeps readings accurate and comparable between instruments.
What are the key features?
- Linear detector array recording full spectra simultaneously
- No moving parts for rugged, compact construction
- Fibre-optic input for remote and inline sampling
- Adjustable integration time for wide dynamic range
- Compact footprint for portable and OEM use
What are the technical specifications?
A typical ccd array spectrometer configuration offers wavelength range of 200–1100 nm, detector of Linear CCD, 2048 pixels, spectral resolution of 0.5–2 nm depending on slit, integration time of 1 ms to 65 s, optical bench of Crossed Czerny-Turner and grating of 600 lines/mm. Values are indicative of the product class; the exact figures for each configuration are confirmed on the quotation and the calibration documents supplied with the instrument.
Which applications is it used for?
The CCD Array Spectrometer is used in inline colour and concentration monitoring, portable field spectroscopy, light source and LED characterization and optical filter and coating transmission checks. Across the wider Spectrometers class, laboratories also deploy it for pharmaceutical identity and content testing, chemical reaction monitoring and optical coating and filter characterization.
Which standards and certifications apply?
Relevant standards and methods include USP <857>, Ph. Eur. 2.2.25, ASTM E275, ASTM E958 and JP 2.24. Certification candidates for this model are CE and ISO 9001 manufacturing; each is to be confirmed for the specific configuration before shipment, and certificates are supplied only where they have been issued.
Install spectrometers on a stable bench away from vibration and large temperature swings, and allow warm-up for source and detector stability. Protect optics from dust and humidity; hygroscopic components such as KBr windows need desiccation or purging. Establish a calibration schedule covering wavelength accuracy, photometric accuracy and stray light, using traceable filters or lamps. Keep reference spectra and performance records for trend analysis. For regulated work, define user access, audit trails and electronic records, and document installation, operational and performance qualification. Regular lamp replacement and cleaning of sample compartments reduce drift.
How do I select the right CCD Array Spectrometer?
Select a CCD array spectrometer for fast, compact or inline measurement where a full spectrum is needed without scanning. Match wavelength range, resolution and integration time to the application, and choose fibre-optic couplings or cuvette holders for the sampling geometry. For low-light work, consider a cooled detector. In an RFQ state the range, resolution, slit width and interface requirements.
How does it compare with other Spectrometers variants?
Choose by measurand first: absorption in the ultraviolet and visible suits a UV-Vis spectrophotometer, trace fluorescence suits a fluorescence spectrometer, non-contact identification of solids and liquids suits a Raman spectrometer, functional-group analysis of solids and liquids suits an FTIR spectrometer, and rapid reflectance or transmission measurements suit a CCD array spectrometer. Then match spectral range, resolution and stray-light performance to the method. Consider whether a double-beam or array design is needed, the required detector sensitivity, and whether a flow cell, fibre probe or integrating sphere is required. Check wavelength accuracy, baseline stability, software for spectral libraries and data integrity, and available calibration standards before specifying.
Full specifications
| Wavelength range | 200–1100 nm |
|---|---|
| Detector | Linear CCD, 2048 pixels |
| Spectral resolution | 0.5–2 nm depending on slit |
| Integration time | 1 ms to 65 s |
| Optical bench | Crossed Czerny-Turner |
| Grating | 600 lines/mm |
| Entrance slit | 25 µm |
| Stray light | ≤0.2% |
| Data interface | USB 2.0 |
| Power supply | USB bus powered |
Indicative values for this product class. Final specifications are confirmed on the quotation and in the calibration documents supplied with the instrument.
Applications
- Inline colour and concentration monitoring
- Portable field spectroscopy
- Light source and LED characterization
- Optical filter and coating transmission checks
Key features
- Linear detector array recording full spectra simultaneously
- No moving parts for rugged, compact construction
- Fibre-optic input for remote and inline sampling
- Adjustable integration time for wide dynamic range
- Compact footprint for portable and OEM use
Frequently asked questions about CCD Array Spectrometer
An array spectrometer captures all wavelengths at once, so measurement is fast and the instrument has no moving parts. This improves reliability and allows compact, portable designs. Scanning instruments may offer higher resolution and lower stray light but are slower and larger.
Resolution is set mainly by entrance slit width, grating dispersion and detector pixel size. A narrower slit improves resolution but reduces light throughput. Users choose a configuration balancing resolution against sensitivity for their application.
Yes, provided the instrument is calibrated and the measurement is stable. Absorbance or intensity is related to concentration through a calibration curve, and integration time, dark reference and reference spectrum are controlled. Repeatability and stray light set the practical limit of concentration range.
Concentration is usually measured with a UV-Vis spectrophotometer, because absorbance follows the Beer–Lambert law and many compounds absorb strongly in the ultraviolet. Fluorescence spectrometers offer lower detection limits for fluorescent analytes. The correct choice depends on the analyte, matrix and required limit of detection.
Spectral resolution is the smallest wavelength difference the instrument can separate, set by slit width, grating and detector. Higher resolution distinguishes closely spaced bands and sharp peaks but reduces light throughput. Choose resolution that matches the narrowest feature the method must resolve.
Yes. Wavelength accuracy drifts with lamp ageing, mechanical change and temperature. Calibration uses emission lines from deuterium or mercury lamps, or certified reference filters, and is verified against defined tolerances. Records of wavelength, photometric and stray-light checks support traceability.
Related models