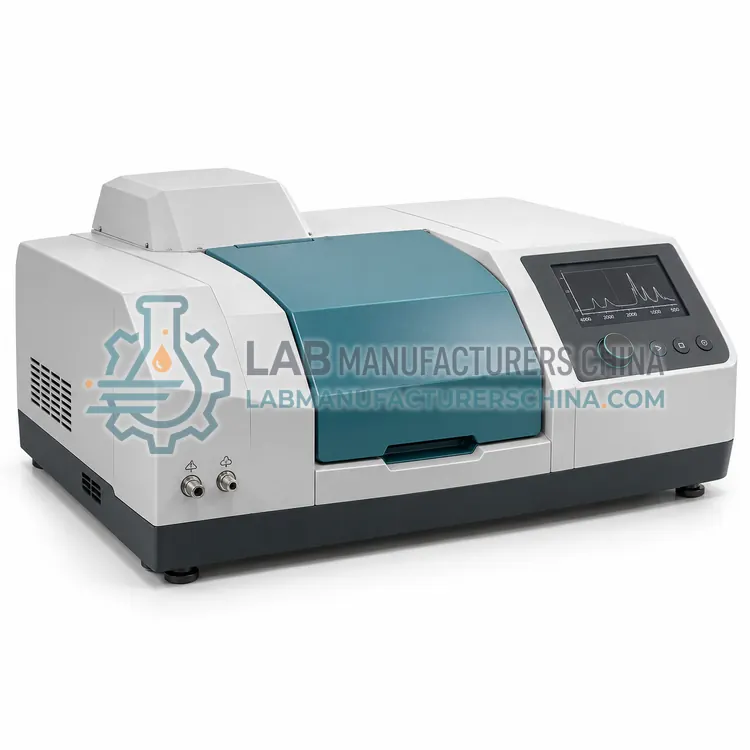
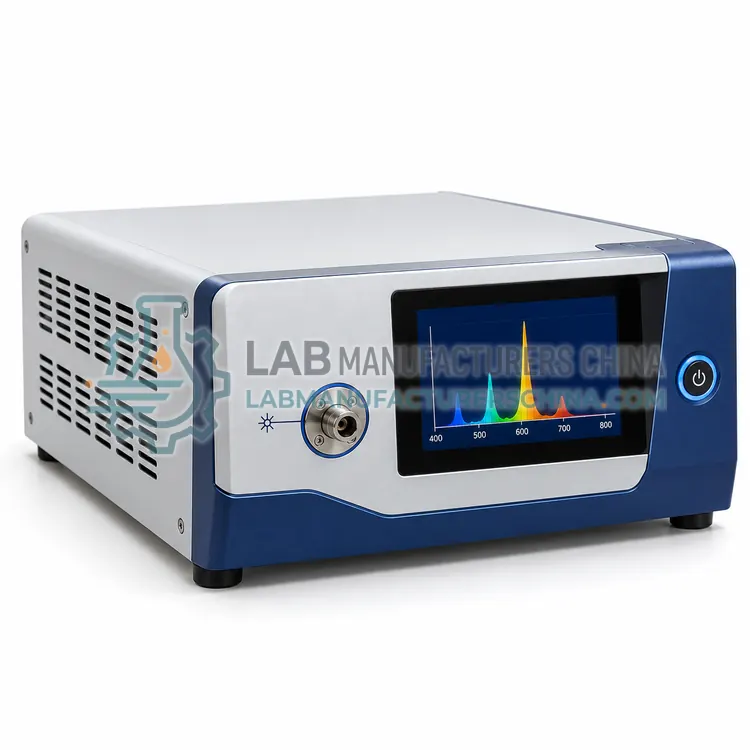
FTIR Spectrometer
傅里叶变换红外光谱仪
- SKU SPC-0004
- Spectrometers
- CE (to be confirmed)
- ISO 9001 manufacturing (to be confirmed)
Price on request — FOB / CIF quoted per order
Prices depend on configuration, quantity and destination port.
Key specifications
| Spectral range | 4000–400 cm⁻¹ |
|---|---|
| Resolution | 0.5–4 cm⁻¹ selectable |
| Signal-to-noise ratio | 30,000:1 at 4 cm⁻¹ |
| Wavenumber accuracy | ±0.01 cm⁻¹ |
| Wavenumber repeatability | 0.01 cm⁻¹ |
| Interferometer | Michelson with KBr beamsplitter |
Request a quote Download brochure · to be provided
By Lab Manufacturers China Technical TeamLast reviewed Standards: USP <857>, Ph. Eur. 2.2.25, ASTM E275
What is the FTIR Spectrometer?
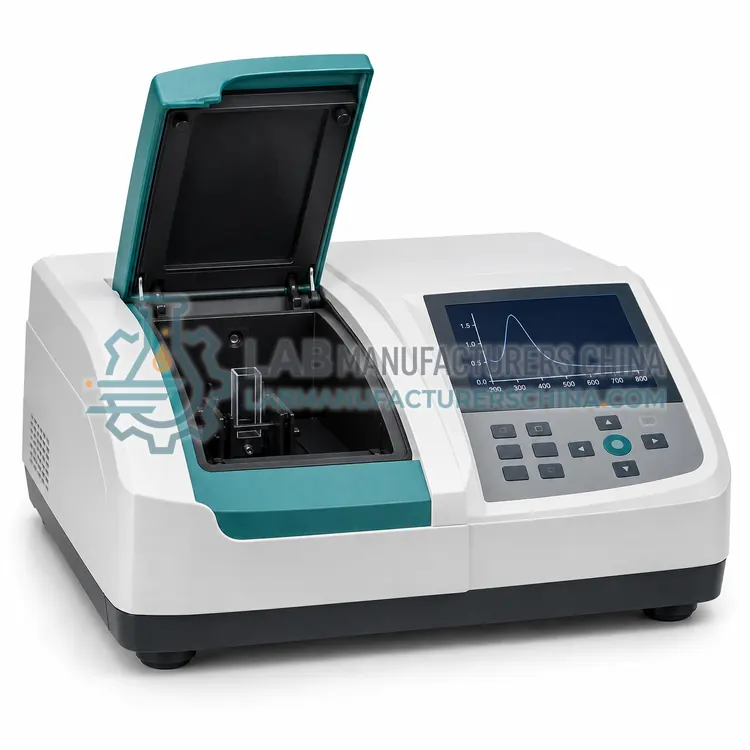
An FTIR spectrometer identifies chemical functional groups by measuring infrared absorption across the mid-infrared range. It is the standard optical instrument for material and polymer identification, contaminant analysis and incoming-goods verification in many quality-control laboratories.
What is the FTIR Spectrometer?
An FTIR spectrometer identifies chemical functional groups by measuring infrared absorption across the mid-infrared range. It is the standard optical instrument for material and polymer identification, contaminant analysis and incoming-goods verification in many quality-control laboratories.
Overview
An FTIR spectrometer uses a Michelson interferometer to modulate infrared light, which passes through or reflects off the sample and reaches a detector. The detector records an interferogram that is converted to a spectrum by Fourier transform. A silicon carbide source, potassium bromide beamsplitter and deuterated triglycine sulfate or mercury cadmium telluride detector cover the mid-infrared region. Resolution, signal-to-noise ratio and wavenumber accuracy determine performance. Attenuated total reflectance accessories allow solids and liquids to be measured with minimal preparation, and spectral libraries support automatic identification. Liquid cells and gas cells extend the technique to solutions and vapours.
How does it work?
A spectrometer collects light from a source or sample and disperses it with a prism, diffraction grating or interferometer. The separated wavelengths fall on a detector, usually a photodiode, charge-coupled device or photomultiplier, which converts intensity into an electrical signal. The signal is digitized and plotted as intensity versus wavelength or wavenumber. Transmission, absorbance or emission bands reveal molecular or atomic structure, because specific groups absorb or emit at characteristic wavelengths. Optical resolution depends on slit width, grating groove density and detector pixel size, while sensitivity depends on source brightness, optical throughput and detector quantum efficiency. Wavelength calibration against emission lamps or reference standards keeps readings accurate and comparable between instruments.
What are the key features?
- Michelson interferometer with potassium bromide beamsplitter
- Attenuated total reflectance accessory for solids and liquids
- High signal-to-noise ratio for short measurement times
- Spectral library search for automatic identification
- Purging or desiccant option for hygroscopic optics
What are the technical specifications?
A typical ftir spectrometer configuration offers spectral range of 4000–400 cm⁻¹, resolution of 0.5–4 cm⁻¹ selectable, signal-to-noise ratio of 30,000:1 at 4 cm⁻¹, wavenumber accuracy of ±0.01 cm⁻¹, wavenumber repeatability of 0.01 cm⁻¹ and interferometer of Michelson with KBr beamsplitter. Values are indicative of the product class; the exact figures for each configuration are confirmed on the quotation and the calibration documents supplied with the instrument.
Which applications is it used for?
The FTIR Spectrometer is used in polymer and plastic identification, pharmaceutical raw material verification, contaminant and failure analysis and coating and surface composition analysis. Across the wider Spectrometers class, laboratories also deploy it for pharmaceutical identity and content testing, chemical reaction monitoring and optical coating and filter characterization.
Which standards and certifications apply?
Relevant standards and methods include USP <857>, Ph. Eur. 2.2.25, ASTM E275, ASTM E958 and JP 2.24. Certification candidates for this model are CE and ISO 9001 manufacturing; each is to be confirmed for the specific configuration before shipment, and certificates are supplied only where they have been issued.
Install spectrometers on a stable bench away from vibration and large temperature swings, and allow warm-up for source and detector stability. Protect optics from dust and humidity; hygroscopic components such as KBr windows need desiccation or purging. Establish a calibration schedule covering wavelength accuracy, photometric accuracy and stray light, using traceable filters or lamps. Keep reference spectra and performance records for trend analysis. For regulated work, define user access, audit trails and electronic records, and document installation, operational and performance qualification. Regular lamp replacement and cleaning of sample compartments reduce drift.
How do I select the right FTIR Spectrometer?
Select an FTIR spectrometer for functional-group and material identification in the mid-infrared. Choose resolution according to the spectral detail required, a purged or desiccated configuration for humid environments, and an attenuated total reflectance accessory for solid and liquid convenience. In an RFQ state resolution, signal-to-noise specification, detector type and library requirements.
How does it compare with other Spectrometers variants?
Choose by measurand first: absorption in the ultraviolet and visible suits a UV-Vis spectrophotometer, trace fluorescence suits a fluorescence spectrometer, non-contact identification of solids and liquids suits a Raman spectrometer, functional-group analysis of solids and liquids suits an FTIR spectrometer, and rapid reflectance or transmission measurements suit a CCD array spectrometer. Then match spectral range, resolution and stray-light performance to the method. Consider whether a double-beam or array design is needed, the required detector sensitivity, and whether a flow cell, fibre probe or integrating sphere is required. Check wavelength accuracy, baseline stability, software for spectral libraries and data integrity, and available calibration standards before specifying.
Full specifications
| Spectral range | 4000–400 cm⁻¹ |
|---|---|
| Resolution | 0.5–4 cm⁻¹ selectable |
| Signal-to-noise ratio | 30,000:1 at 4 cm⁻¹ |
| Wavenumber accuracy | ±0.01 cm⁻¹ |
| Wavenumber repeatability | 0.01 cm⁻¹ |
| Interferometer | Michelson with KBr beamsplitter |
| Detector | DTGS or MCT |
| Light source | Silicon carbide |
| Beamsplitter | Potassium bromide |
| Data interface | USB, LAN |
Indicative values for this product class. Final specifications are confirmed on the quotation and in the calibration documents supplied with the instrument.
Applications
- Polymer and plastic identification
- Pharmaceutical raw material verification
- Contaminant and failure analysis
- Coating and surface composition analysis
Key features
- Michelson interferometer with potassium bromide beamsplitter
- Attenuated total reflectance accessory for solids and liquids
- High signal-to-noise ratio for short measurement times
- Spectral library search for automatic identification
- Purging or desiccant option for hygroscopic optics
Frequently asked questions about FTIR Spectrometer
Transmission passes infrared light through a thin sample such as a potassium bromide pellet or liquid cell. ATR reflects light through a high-index crystal contacting the sample, sampling a thin surface layer. ATR needs almost no preparation and is convenient, but spectra may shift slightly relative to transmission.
Common beamsplitter and window materials such as potassium bromide are hygroscopic and cloud when exposed to humid air, reducing throughput and causing spectral artefacts. Instruments are protected by desiccant, dry-air purging or sealed optics, and desiccant should be regenerated on schedule.
Performance is checked using a polystyrene film for wavenumber accuracy and resolution, and by measuring noise and energy throughput. Reference spectra and acceptance tolerances are recorded, and the checks are repeated at intervals defined by the quality system to detect drift over time.
Concentration is usually measured with a UV-Vis spectrophotometer, because absorbance follows the Beer–Lambert law and many compounds absorb strongly in the ultraviolet. Fluorescence spectrometers offer lower detection limits for fluorescent analytes. The correct choice depends on the analyte, matrix and required limit of detection.
Spectral resolution is the smallest wavelength difference the instrument can separate, set by slit width, grating and detector. Higher resolution distinguishes closely spaced bands and sharp peaks but reduces light throughput. Choose resolution that matches the narrowest feature the method must resolve.
Yes. Wavelength accuracy drifts with lamp ageing, mechanical change and temperature. Calibration uses emission lines from deuterium or mercury lamps, or certified reference filters, and is verified against defined tolerances. Records of wavelength, photometric and stray-light checks support traceability.
Related models