Flow Cytometer Acquisition and Control Software
流式细胞仪采集与控制软件
- ISO 13485 software lifecycle (to be confirmed)
- +2
Welcome to Lab Manufacturers China — laboratory instruments direct from a Chinese manufacturer
高维流式数据分析软件
Price on request — FOB / CIF quoted per order
Prices depend on configuration, quantity and destination port.
| Dimensionality reduction | tSNE, UMAP, PCA |
|---|---|
| Clustering algorithms | FlowSOM, PhenoGraph, X-shift, k-means |
| Parameter capacity | Up to 50+ markers |
| Events per analysis | Up to several million (with downsampling) |
| Batch normalization | Bead-based or statistical methods |
| Scripting integration | R and Python |
By Lab Manufacturers China Technical TeamLast reviewed Standards: ISAC FCS 3.1 data standard, ISAC FCS 3.2 data standard, ISAC MIFlowCyt
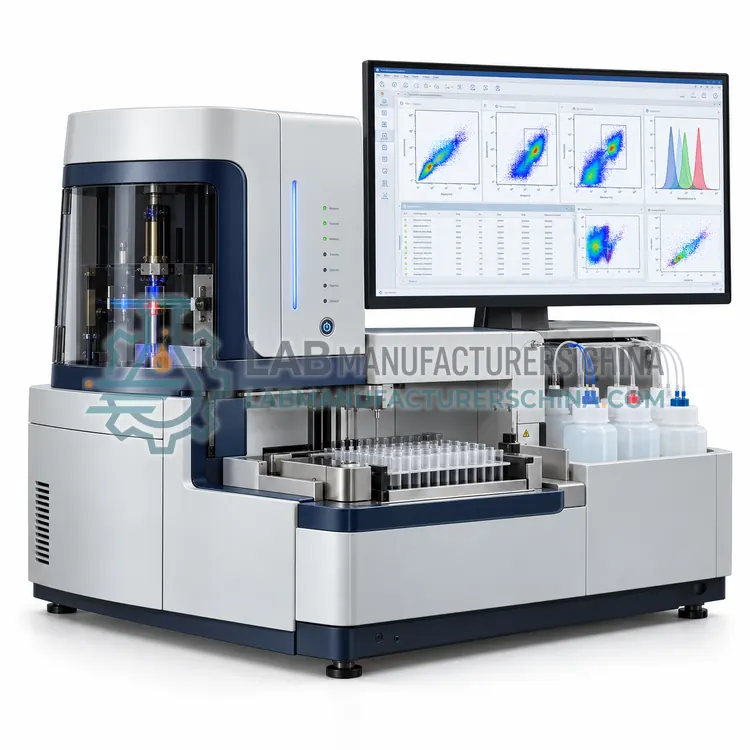
High-dimensional flow data analysis software applies dimensionality reduction and unsupervised clustering to cytometry datasets with 15 to 50 or more parameters. It uses tSNE, UMAP and FlowSOM-type algorithms to discover populations that manual two-dimensional gating would miss or handle inconsistently.
High-dimensional flow data analysis software applies dimensionality reduction and unsupervised clustering to cytometry datasets with 15 to 50 or more parameters. It uses tSNE, UMAP and FlowSOM-type algorithms to discover populations that manual two-dimensional gating would miss or handle inconsistently.
As panels exceed 15 colors, manual sequential gating becomes impractical and subjective. High-dimensional analysis software supports quality control steps such as flow-rate and signal stability checks, then batch-corrects and normalizes data across runs. Dimensionality reduction with tSNE or UMAP embeds each cell in two dimensions, and unsupervised clustering with FlowSOM, PhenoGraph or X-shift groups cells into phenotypes that can be annotated and compared between samples. Differential abundance and marker expression testing identify clusters that differ between disease and control groups. Many packages run as plugins within analysis software or as stand-alone tools in R or Python, processing millions of events with downsampling and concatenation. Workflows must be validated because results depend on parameter choices, random seeds and preprocessing, and outputs should be checked against known biology and manual gating.
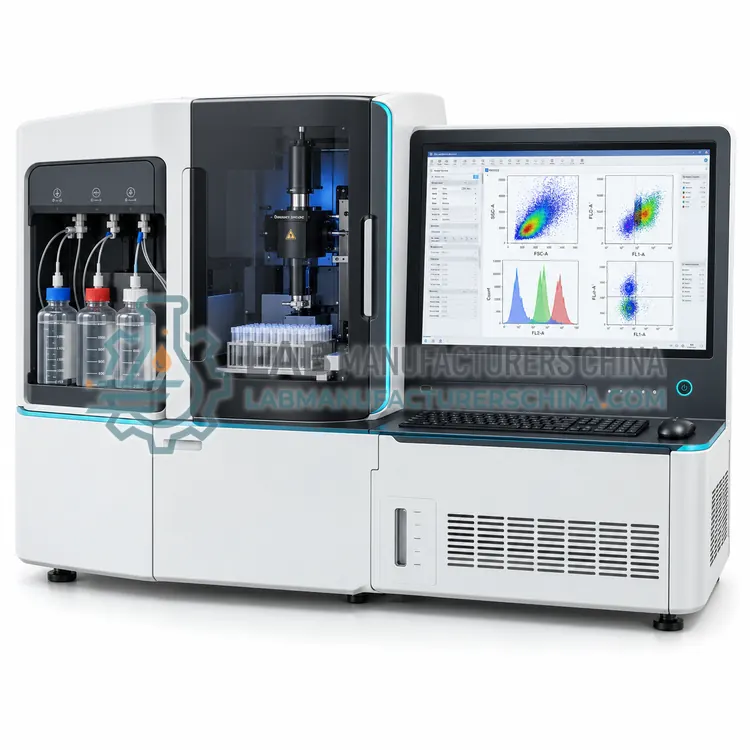
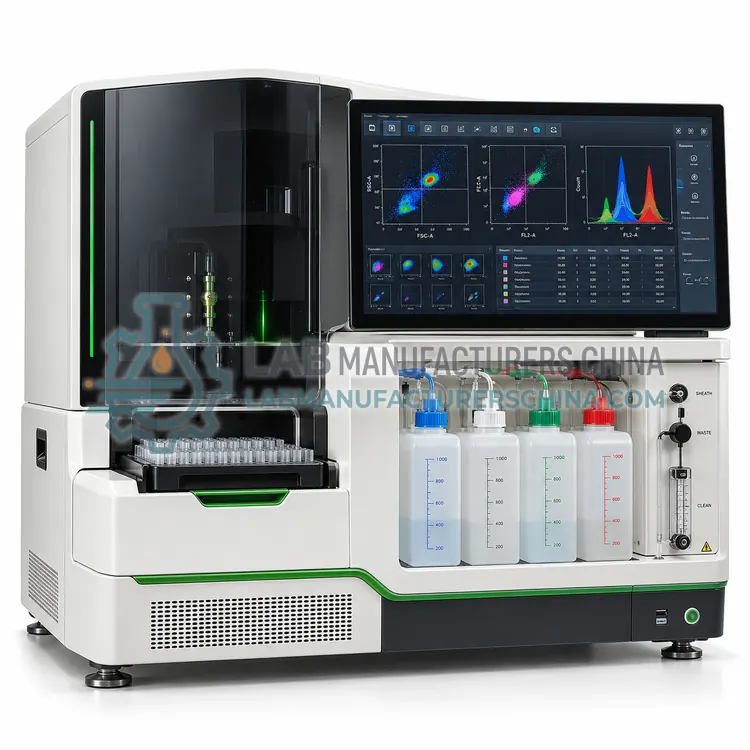
Cytometry software handles three stages. During acquisition it configures detector voltages, thresholds and gains, triggers on defined parameters, and writes each event's scatter and fluorescence values to list-mode FCS files with metadata. Analysis software then applies compensation or spectral unmixing to correct spillover, transforms data with logicle or biexponential scales to display negative values, and lets users draw hierarchical gates on histograms and dot plots to define populations. It calculates statistics such as percent parent, median fluorescence intensity and coefficient of variation. High-dimensional tools add dimensionality reduction with tSNE or UMAP and unsupervised clustering with algorithms such as FlowSOM or PhenoGraph. Regulated platforms add user authentication, audit trails, electronic signatures and validated templates.
A typical high-dimensional flow data analysis software configuration offers dimensionality reduction of tSNE, UMAP, PCA, clustering algorithms of FlowSOM, PhenoGraph, X-shift, k-means, parameter capacity of Up to 50+ markers, events per analysis of Up to several million (with downsampling), batch normalization of Bead-based or statistical methods and scripting integration of R and Python. Values are indicative of the product class; the exact figures for each configuration are confirmed on the quotation and the calibration documents supplied with the instrument.
The High-Dimensional Flow Data Analysis Software is used in deep immune profiling studies, biomarker discovery in clinical trials, tumor microenvironment phenotyping, mass cytometry and spectral data analysis and cross-site data integration. Across the wider Cytometry Software class, laboratories also deploy it for instrument acquisition and quality control, offline flow data analysis and reporting and high-dimensional immune profiling.
Relevant standards and methods include ISAC FCS 3.1 data standard, ISAC FCS 3.2 data standard, ISAC MIFlowCyt, 21 CFR Part 11, EU GMP Annex 11, GAMP 5 and CLSI H62. Certification candidates for this model are ISO 9001 software development, CE and GAMP 5 documentation available; each is to be confirmed for the specific configuration before shipment, and certificates are supplied only where they have been issued.
Install acquisition software only on the validated workstation supplied or approved for the cytometer, with operating system updates under change control. Back up FCS data to network storage on a schedule and follow the MIFlowCyt guideline to record experiment metadata for reproducibility. Validate compensation matrices with single-stain controls and review gating strategies with fluorescence-minus-one controls. Standardize gating templates across users to reduce analyst variability. For regulated work, perform installation, operational and performance qualification, lock methods and templates, and review audit trails periodically. Keep license keys and software versions documented, and confirm that exported data remain readable in future software releases.
Choose high-dimensional software for panels above about 15 markers, large cohorts or discovery studies. Plan for compute resources, memory and analyst training. In an RFQ specify algorithms needed, maximum events, scripting support, batch correction, license model and hardware requirements.
Select software according to the task and the regulatory environment. Confirm instrument compatibility first, since acquisition software is tied to a specific cytometer and firmware. For analysis, verify support for FCS 2.0, 3.0, 3.1 and 3.2 files, compensation and unmixing matrices, batch processing and export of publication-quality graphs. For high-dimensional work, check for built-in tSNE, UMAP, FlowSOM and integration with R or Python. Regulated laboratories need 21 CFR Part 11 or equivalent functionality, meaning audit trails, electronic signatures, role-based access and validation documentation. Consider licensing model, including perpetual, subscription, floating or site licenses, data storage and cloud options, operating system support, and whether technical support and training are available locally.
| Dimensionality reduction | tSNE, UMAP, PCA |
|---|---|
| Clustering algorithms | FlowSOM, PhenoGraph, X-shift, k-means |
| Parameter capacity | Up to 50+ markers |
| Events per analysis | Up to several million (with downsampling) |
| Batch normalization | Bead-based or statistical methods |
| Scripting integration | R and Python |
| Statistical testing | Differential abundance, marker expression |
| Input formats | FCS 3.0/3.1/3.2, CSV |
| Recommended RAM | 32–64 GB |
| GPU acceleration | Optional (CUDA) |
Indicative values for this product class. Final specifications are confirmed on the quotation and in the calibration documents supplied with the instrument.
Both reduce many parameters to two dimensions for visualization. tSNE emphasizes local neighborhoods and is slower on large datasets, while UMAP is faster and preserves more global structure. Neither distances nor cluster sizes should be over-interpreted quantitatively.
FlowSOM is an unsupervised clustering algorithm that uses self-organizing maps to group cells by marker similarity, followed by metaclustering. It is fast on millions of events, and results are commonly visualized as minimum spanning trees of cell clusters.
Not entirely. Manual gating remains the reference for well-defined populations and for regulated work, while clustering complements it by exposing unexpected populations. Results are typically confirmed by manual gating of key clusters.
It controls the instrument during acquisition, records each event to FCS files, and then supports analysis by compensation, gating, statistics and plotting. Advanced software adds dimensionality reduction, clustering and batch processing, and regulated packages add audit trails and electronic signatures.
FCS is the Flow Cytometry Standard defined by the International Society for Advancement of Cytometry. It stores list-mode event data and metadata such as parameters, voltages and compensation in a single file, with versions 3.0, 3.1 and 3.2 in current use.
You need it when electronic records support regulated decisions, such as GMP release testing or clinical trial submissions to the FDA. Compliance requires audit trails, electronic signatures, access control and validation, and the lab's procedures must also support these controls.
流式细胞仪采集与控制软件
离线流式细胞术数据分析软件
符合 21 CFR Part 11 的临床流式细胞术软件
云端流式细胞术数据管理平台