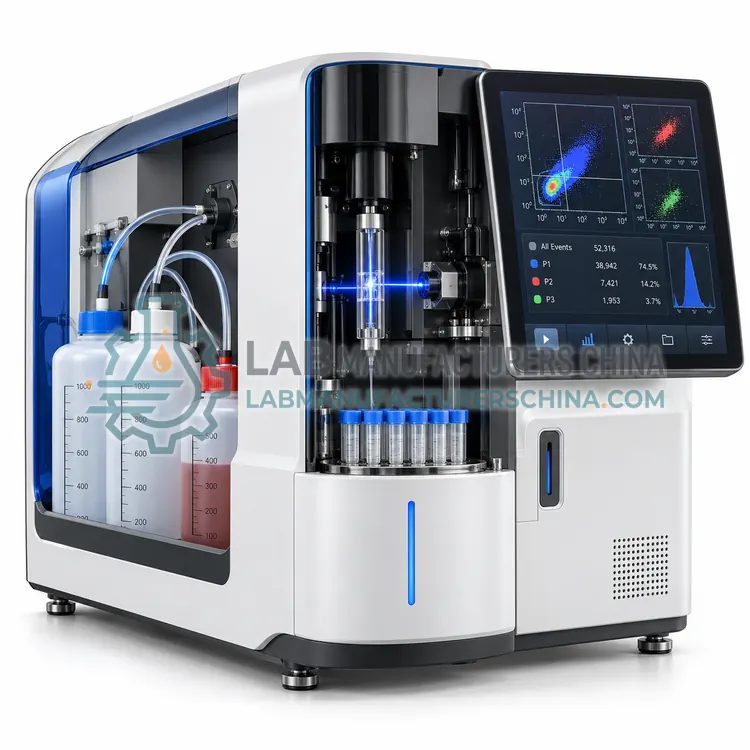
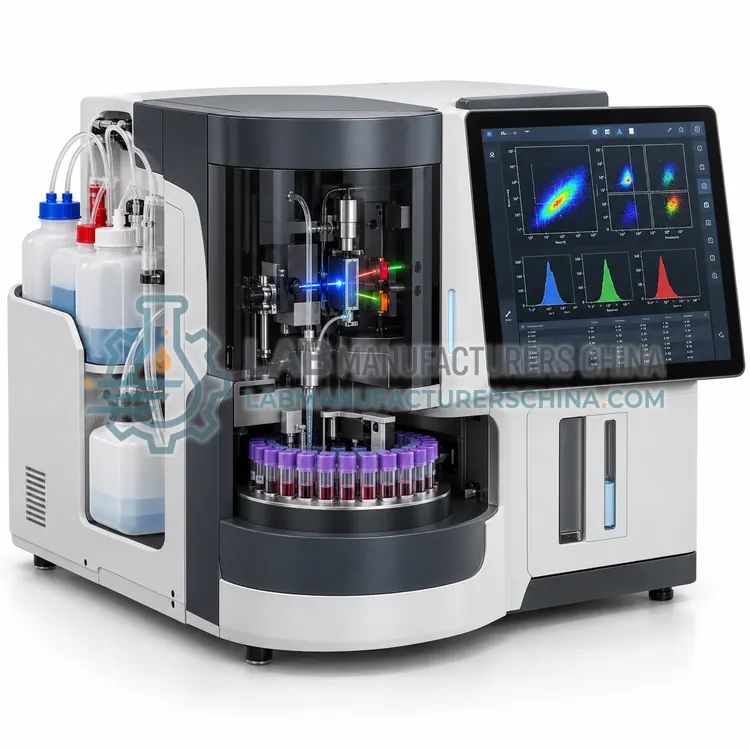
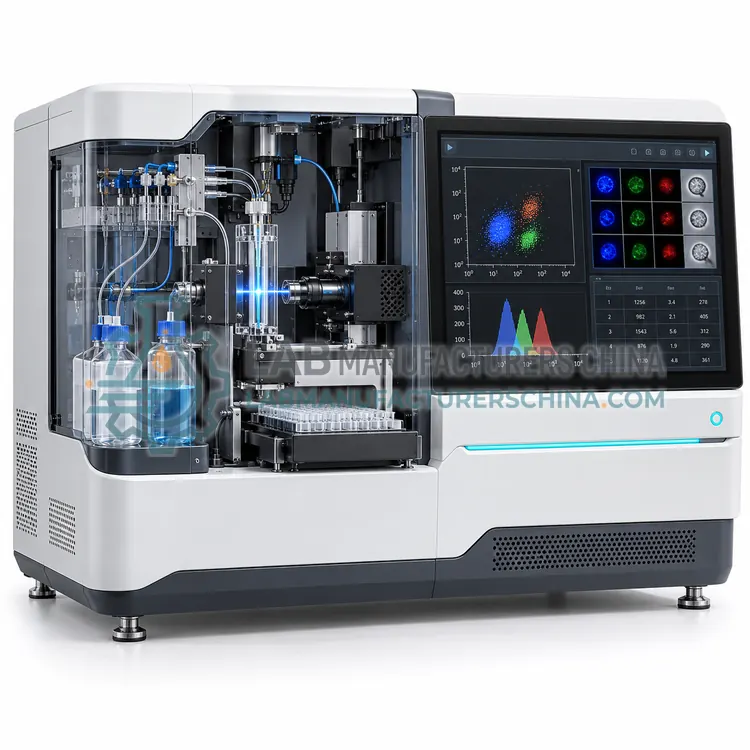
Imaging Flow Cytometer
成像流式细胞仪
- SKU CAN-0003
- Cell Analyzers
- CE (to be confirmed)
- ISO 9001 manufacturing (to be confirmed)
- IEC 61010-1 safety (to be confirmed)
- IEC 60825-1 laser safety (to be confirmed)
Price on request — FOB / CIF quoted per order
Prices depend on configuration, quantity and destination port.
Key specifications
| Imaging channels | Brightfield plus 6–12 fluorescence channels |
|---|---|
| Magnification | approx. 20x, 40x or 60x objectives |
| Throughput | up to 5,000 cells per second |
| Camera | High-speed time-delay integration CCD or CMOS |
| Lasers | 405, 488, 561 and 640 nm typical |
| Resolution | approx. 0.5 µm per pixel at 60x |
Request a quote Download brochure · to be provided
By Lab Manufacturers China Technical TeamLast reviewed Standards: IEC 60825-1, IEC 61010-1, ISO 15189
What is the Imaging Flow Cytometer?
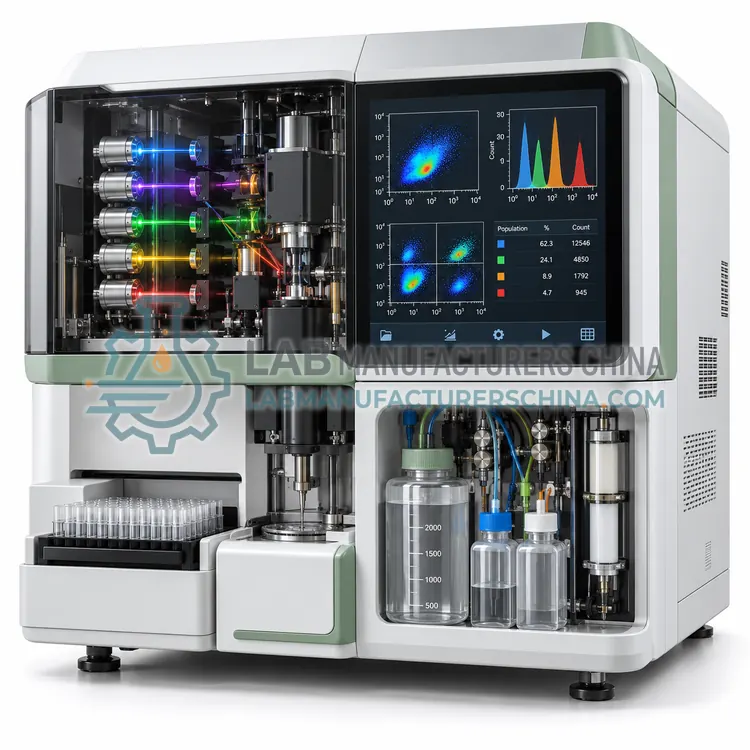
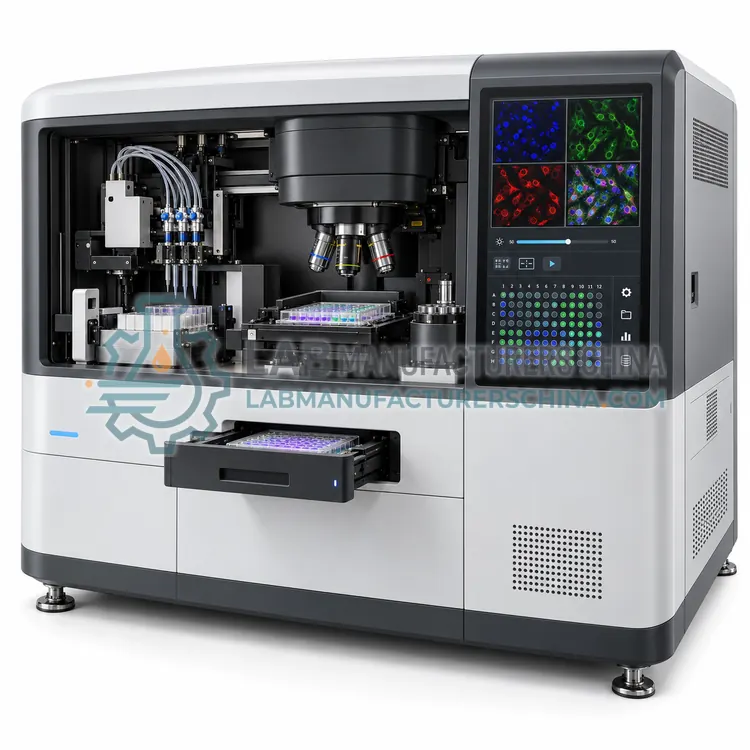
An imaging flow cytometer captures brightfield and multi-channel fluorescence images of every cell in flow, combining the statistical power of flow cytometry with microscopy-level morphology, signal localisation and cell-cell interaction data for detailed cell analysis.
What is the Imaging Flow Cytometer?
An imaging flow cytometer captures brightfield and multi-channel fluorescence images of every cell in flow, combining the statistical power of flow cytometry with microscopy-level morphology, signal localisation and cell-cell interaction data for detailed cell analysis.
Overview
Cells are hydrodynamically focused and imaged as they pass a high-speed camera, producing a brightfield image plus several fluorescence images for each event, typically at 40x to 60x magnification. Because images rather than single intensity values are recorded, analysis software can compute nuclear translocation, internalisation, spot counting, cell shape descriptors and co-localisation, and it can apply masks to measure signal in defined compartments. Throughput of thousands of cells per second gives statistically robust morphological data that conventional microscopy cannot reach, and rare events can be identified morphologically and reviewed image by image. Compensation and blur are handled in software, and fluorescent intensity data can also be exported for conventional gating. Sample preparation follows standard staining and fixation protocols.
How does it work?
Flow-based cell analyzers suspend cells in a sheath fluid that hydrodynamically focuses them into a single file. Each cell passes one or more laser beams, and detectors record forward scatter, which relates to size, side scatter, which relates to granularity, and fluorescence from labelled antibodies or reporter proteins. Thousands of cells are measured per second, so rare populations can be quantified with statistical confidence. Spectral analyzers capture the full emission spectrum for each event and unmix overlapping dyes computationally, allowing larger panels. Imaging cytometers capture a brightfield and fluorescence image of each cell in flow, adding morphology and localisation information. Metabolic analyzers measure oxygen consumption and extracellular acidification in a plate by repeatedly sampling the medium above the cells, giving a readout of oxidative phosphorylation and glycolysis. Dedicated cell cycle analyzers measure DNA content and apoptosis markers with fixed panels.
What are the key features?
- Brightfield plus up to 12 fluorescence channels per cell
- High-speed imaging at thousands of cells per second
- Software masks for nuclear translocation and internalisation
- Spot counting and co-localisation analysis
- Morphology-based identification of rare events
- Fluorescence data exportable for conventional gating
What are the technical specifications?
A typical imaging flow cytometer configuration offers imaging channels of Brightfield plus 6–12 fluorescence channels, magnification of approx. 20x, 40x or 60x objectives, throughput of up to 5,000 cells per second, camera of High-speed time-delay integration CCD or CMOS, lasers of 405, 488, 561 and 640 nm typical and resolution of approx. 0.5 µm per pixel at 60x. Values are indicative of the product class; the exact figures for each configuration are confirmed on the quotation and the calibration documents supplied with the instrument.
Which applications is it used for?
The Imaging Flow Cytometer is used in nuclear translocation and signalling studies, receptor internalisation and trafficking, phagocytosis and cell-cell interaction assays and rare event detection with morphological confirmation. Across the wider Cell Analyzers class, laboratories also deploy it for immunophenotyping of cell populations, cell cycle and apoptosis analysis and cell therapy product characterisation.
Which standards and certifications apply?
Relevant standards and methods include IEC 60825-1, IEC 61010-1, ISO 15189, CLSI H42, USP <1046> and ISO 17025. Certification candidates for this model are CE, ISO 9001 manufacturing, IEC 61010-1 safety and IEC 60825-1 laser safety; each is to be confirmed for the specific configuration before shipment, and certificates are supplied only where they have been issued.
Standardise sample preparation, since cell number, staining volume, incubation time and wash steps all shift signal intensity. Include single-stain compensation controls and an unstained control in every experiment, and run reference beads for instrument setup and daily quality control. Keep sheath fluid and waste containers at the correct levels, and follow the manufacturer's cleaning procedure to limit carry-over below 1%. Lasers fall under IEC 60825-1, so protective covers and interlocks must remain functional and staff should be trained. Fixed cells for DNA content analysis need correct fixation and RNase treatment. For regulated work, document compensation, gating strategy, acquisition settings and software version, and retain raw FCS files so that analyses can be reproduced.
How do I select the right Imaging Flow Cytometer?
Select an imaging cytometer when the answer depends on where a signal is located inside or on a cell, or on cell shape and contact, rather than on intensity alone. Specify imaging channels and magnification, throughput, analysis features such as masks and spot counting, and data storage needs.
How does it compare with other Cell Analyzers variants?
Define the panel before specifying hardware. Count how many fluorophores must be measured simultaneously, then check that the laser and detector configuration can resolve them, including compensation or spectral unmixing capability. Conventional benchtop systems suit routine 4–10 colour panels for immunophenotyping and cell cycle work. Spectral systems are appropriate when panels exceed about 12 colours or when autofluorescence varies between samples. Imaging cytometry answers questions involving cell shape, internalisation or cell-cell contact that scatter and fluorescence alone cannot resolve. Metabolic analysis addresses a different question entirely: how cells produce energy, and how they respond to inhibitors or genetic changes. All platforms need consistent sample preparation, validated compensation or unmixing controls, and documented acquisition settings so that results remain comparable between runs.
Full specifications
| Imaging channels | Brightfield plus 6–12 fluorescence channels |
|---|---|
| Magnification | approx. 20x, 40x or 60x objectives |
| Throughput | up to 5,000 cells per second |
| Camera | High-speed time-delay integration CCD or CMOS |
| Lasers | 405, 488, 561 and 640 nm typical |
| Resolution | approx. 0.5 µm per pixel at 60x |
| Sample volume | 50–500 µL per acquisition |
| Analysis features | Mask-based intensity, spot count, shape and co-localisation |
| Data output | Image files with FCS-like event data |
| Dimensions (W x D x H) | approx. 700 x 700 x 700 mm |
Indicative values for this product class. Final specifications are confirmed on the quotation and in the calibration documents supplied with the instrument.
Applications
- Nuclear translocation and signalling studies
- Receptor internalisation and trafficking
- Phagocytosis and cell-cell interaction assays
- Rare event detection with morphological confirmation
Key features
- Brightfield plus up to 12 fluorescence channels per cell
- High-speed imaging at thousands of cells per second
- Software masks for nuclear translocation and internalisation
- Spot counting and co-localisation analysis
- Morphology-based identification of rare events
- Fluorescence data exportable for conventional gating
Frequently asked questions about Imaging Flow Cytometer
Both measure thousands of cells, but the imaging cytometer records pictures instead of single intensity values. That allows measurements such as nuclear translocation, internalisation and co-localisation that cannot be derived from scatter and fluorescence intensity alone.
Acquire at least a few thousand cells for population statistics, and tens of thousands when morphological features must be compared quantitatively. Image data are large, so acquisition numbers should be planned against storage capacity.
Staining and fixation follow standard protocols, but cells must be free of large aggregates to avoid blockage. Filters or a 40 µm mesh are commonly used, and concentration should be adjusted to the instrument's recommended range.
Conventional benchtop analysers typically resolve 4–12 fluorescence colours using two to four lasers, while spectral analysers support panels above 12 colours by capturing full emission spectra. Practical panel size is limited by dye overlap and by the number of available detectors.
It measures oxygen consumption rate and extracellular acidification rate in a multi-well plate while injecting compounds. These readouts reflect mitochondrial respiration and glycolysis, allowing cells to be compared under different nutrients, inhibitors or genetic backgrounds.
Fluorophores emit across a range of wavelengths, so signal from one dye appears in detectors assigned to others. Single-stain controls allow the software to calculate and subtract that spillover, keeping populations in their correct quadrants and preventing false positive calls.
Related models