Automated Confluence Monitoring System
自动汇合度监测系统
- SKU CUM-0001
- Culture Monitoring
- CE (to be confirmed)
- ISO 9001 manufacturing (to be confirmed)
- IEC 61010-1 safety (to be confirmed)
Price on request — FOB / CIF quoted per order
Prices depend on configuration, quantity and destination port.
Key specifications
| Confluence range | 1–100% |
|---|---|
| Confluence accuracy | within ±5% of manual estimate (typical) |
| Measurement interval | programmable, 5 min to 24 h |
| Vessels monitored | 1–8 flasks or plates (model dependent) |
| Imaging mode | Brightfield or phase contrast, optional fluorescence |
| Field of view | approx. 2–10 mm² per image |
Request a quote Download brochure · to be provided
By Lab Manufacturers China Technical TeamLast reviewed Standards: IEC 61010-1, IEC 61326-1, ISO 14644-1
What is the Automated Confluence Monitoring System?
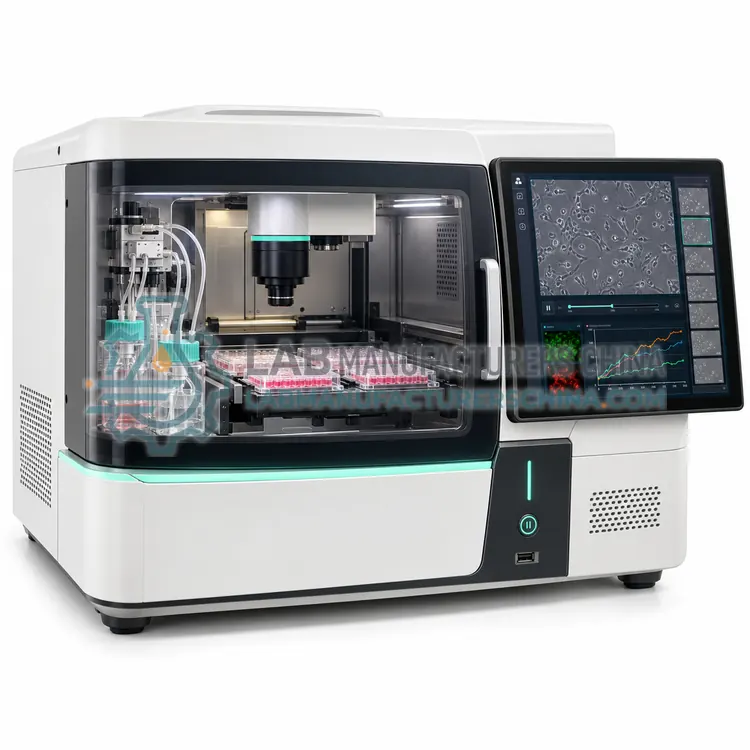
An automated confluence monitoring system images culture vessels inside an incubator and reports the percentage of the surface covered by cells, timing passaging and harvest decisions without the culture leaving the incubator at any point.
What is the Automated Confluence Monitoring System?
An automated confluence monitoring system images culture vessels inside an incubator and reports the percentage of the surface covered by cells, timing passaging and harvest decisions without the culture leaving the incubator at any point.
Overview
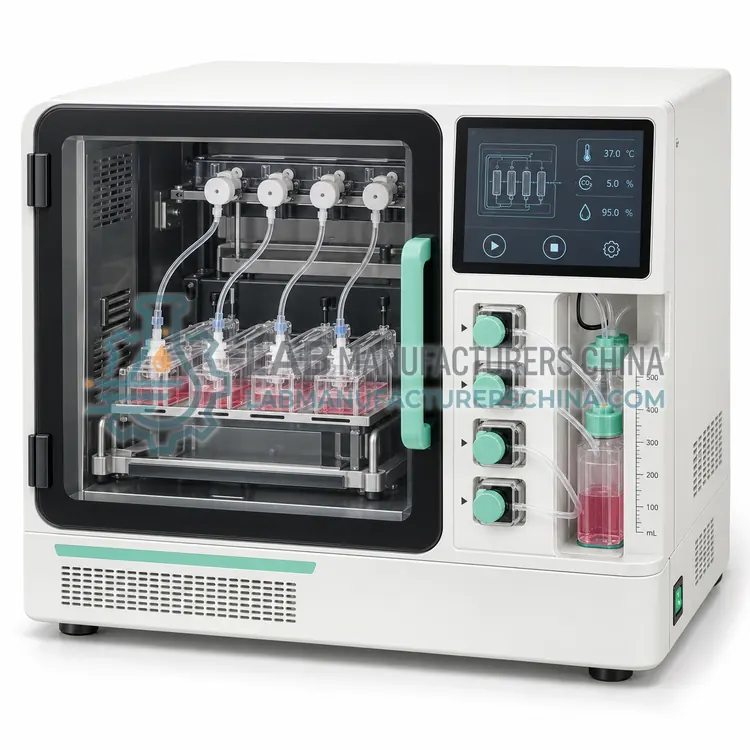
A camera and illumination unit are built into a compact unit that fits inside the incubator or attaches to a flask. Images are analysed to segment cells from background, and confluence is reported as a percentage, with optional counts of fluorescent objects where a fluorescence channel is fitted. Multi-vessel versions image several flasks or plates on a schedule and build growth curves automatically, so the operator sees when a culture reaches the target confluence. Measurement interval can be set from minutes to hours, and the low light dose avoids phototoxicity in sensitive cells. Accuracy depends on cell morphology, confluence range and illumination uniformity, so the system should be checked against manual estimates for each cell type.
How does it work?
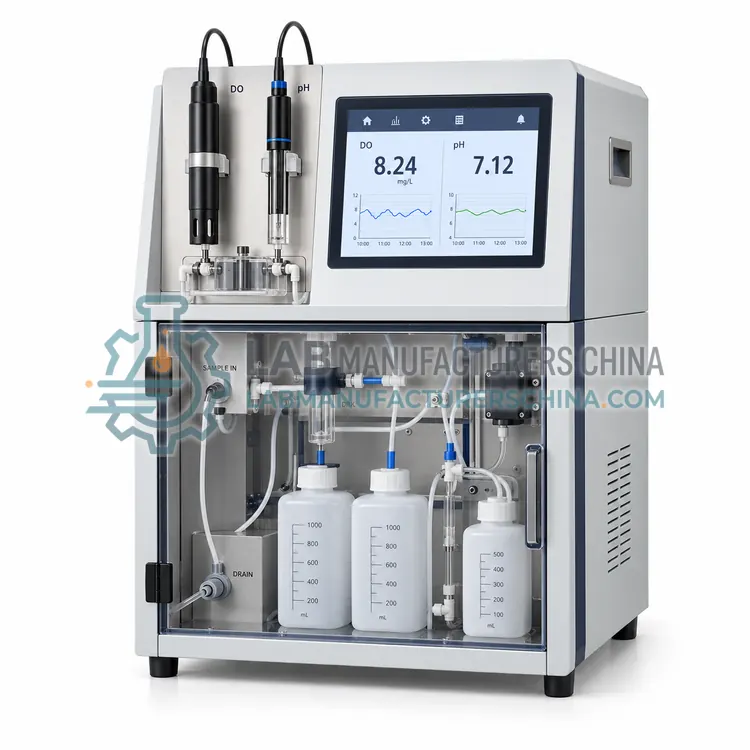
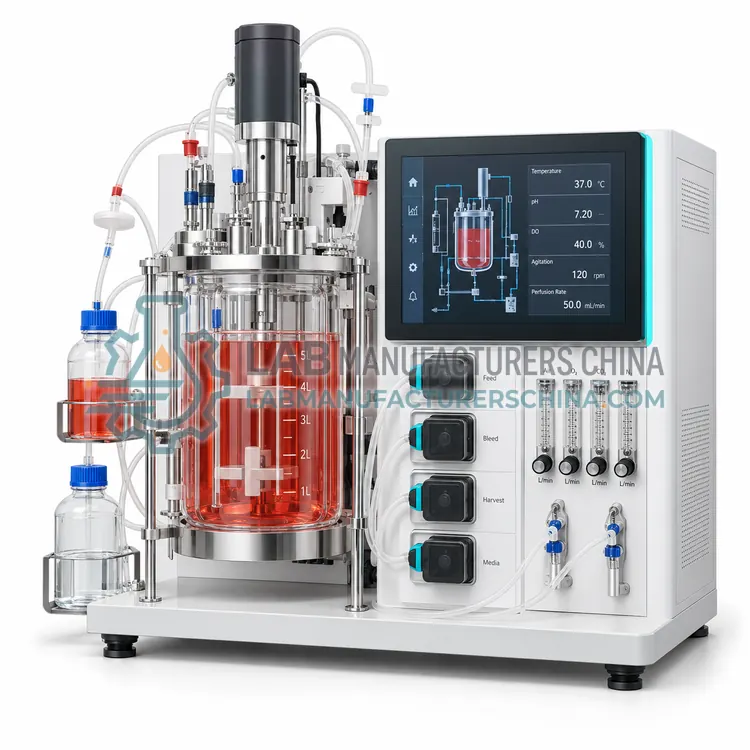
Monitoring methods translate a physical or chemical property of the culture into a usable signal. Imaging systems illuminate the culture surface and estimate confluence from the fraction of the area occupied by cells, or count fluorescent objects to give viable cell density. Capacitance probes apply a radio-frequency field across the culture; viable cells with intact membranes behave as polarisable particles whose signal is proportional to viable cell volume, while dead cells and debris contribute little. Dissolved oxygen is measured with electrochemical or optical sensors, and pH with glass or optical sensors, both of which can be steam-sterilised for bioreactor use. Metabolite analysers use enzyme-based or optical assays to quantify glucose, lactate, glutamine and ammonia in culture samples. Raman spectroscopy adds in-line multi-component measurement when a chemometric model has been calibrated for the process.
What are the key features?
- In-incubator imaging without disturbing the culture
- Confluence reported as a percentage with growth curves
- Optional fluorescence channel for labelled cell counts
- Programmable measurement interval from minutes to hours
- Multi-vessel scheduling for parallel cultures
- Low light dose to avoid phototoxicity
What are the technical specifications?
A typical automated confluence monitoring system configuration offers confluence range of 1–100%, confluence accuracy of within ±5% of manual estimate (typical), measurement interval of programmable, 5 min to 24 h, vessels monitored of 1–8 flasks or plates (model dependent), imaging mode of Brightfield or phase contrast, optional fluorescence and field of view of approx. 2–10 mm² per image. Values are indicative of the product class; the exact figures for each configuration are confirmed on the quotation and the calibration documents supplied with the instrument.
Which applications is it used for?
The Automated Confluence Monitoring System is used in passaging and harvest timing, growth curve generation for experiments, cell therapy expansion monitoring and consistency checks across parallel cultures. Across the wider Culture Monitoring class, laboratories also deploy it for feeding and harvest timing decisions, bioreactor process control and scale-up and contamination and stress detection.
Which standards and certifications apply?
Relevant standards and methods include IEC 61010-1, IEC 61326-1, ISO 14644-1, USP <1046> and ISO 20387. Certification candidates for this model are CE, ISO 9001 manufacturing and IEC 61010-1 safety; each is to be confirmed for the specific configuration before shipment, and certificates are supplied only where they have been issued.
Calibrate each sensor against the reference method used in your laboratory, and record the calibration coefficients, since drift differs between probe types and affects decisions. For optical sensors, check the excitation wavelength and the dye's sensitivity to pH, ionic strength and temperature, which must be matched to the culture conditions. Capacitance probes require a defined conductivity window, so the medium formulation cannot change without re-validation. Sampling for metabolite analysis should be consistent in timing and dilution, and the analyser should be checked with standards daily. Clean and sterilise probes according to the manufacturer's instructions, since residues from previous runs cause drift, and replace consumable sensors at the recommended interval rather than at failure. Keep trend data rather than single values, because rates of change are usually more informative.
How do I select the right Automated Confluence Monitoring System?
Select a confluence monitoring system when passaging or harvest decisions depend on measured growth and when cultures must stay in the incubator between observations. Specify confluence accuracy, vessel capacity, imaging interval, fluorescence options and incubator compatibility.
How does it compare with other Culture Monitoring variants?
Decide what decision the data must support. If the question is when to passage or harvest an adherent culture, automated confluence imaging is sufficient and simple. If viable cell density drives feeding or infection timing, capacitance biomass monitoring provides a real-time signal without sampling. For process control in a bioreactor, dissolved oxygen, pH and temperature probes are essential, and metabolite analysis adds the information needed to adjust perfusion or feed rates. Raman or near-infrared in-line analysers are justified only when the modelling effort can be sustained and the process runs often enough to benefit. Check measurement range and accuracy, response time, sterilisation method, whether the sensor contacts the culture, calibration and drift behaviour, integration with control software, and the frequency of consumable or probe replacement.
Full specifications
| Confluence range | 1–100% |
|---|---|
| Confluence accuracy | within ±5% of manual estimate (typical) |
| Measurement interval | programmable, 5 min to 24 h |
| Vessels monitored | 1–8 flasks or plates (model dependent) |
| Imaging mode | Brightfield or phase contrast, optional fluorescence |
| Field of view | approx. 2–10 mm² per image |
| Incubator compatibility | Designed for 37 °C and 90% relative humidity |
| Data output | Time series of confluence with images |
| Light dose | Low intensity LED with short exposure |
| Dimensions (W x D x H) | approx. 250 x 250 x 250 mm |
Indicative values for this product class. Final specifications are confirmed on the quotation and in the calibration documents supplied with the instrument.
Applications
- Passaging and harvest timing
- Growth curve generation for experiments
- Cell therapy expansion monitoring
- Consistency checks across parallel cultures
Key features
- In-incubator imaging without disturbing the culture
- Confluence reported as a percentage with growth curves
- Optional fluorescence channel for labelled cell counts
- Programmable measurement interval from minutes to hours
- Multi-vessel scheduling for parallel cultures
- Low light dose to avoid phototoxicity
Frequently asked questions about Automated Confluence Monitoring System
Typically within about 5% of a careful manual estimate for healthy monolayers between 10% and 90% confluence. Accuracy degrades for cells with long processes, dense overgrowth or debris, so the system should be verified for each cell type.
With low-intensity LEDs and short exposures the light dose is minimal, and no moving parts enter the vessel. Cultures imaged every 15–60 minutes typically show no measurable difference from undisturbed controls.
On models with a fluorescence channel, yes. GFP or dye-labelled cells can be counted and reported as a percentage of the field, which is useful for tracking transfection efficiency or reporter expression over time.
A camera images the culture surface in brightfield or phase contrast, and software segments cells from background to calculate the percentage of area covered. Accuracy depends on cell morphology and illumination consistency, so the same protocol should be used for comparisons.
A radio-frequency field polarises intact cells, and the resulting signal is proportional to the volume fraction of viable cells. Dead cells and debris contribute little because their membranes no longer maintain charge separation, so the reading tracks viable biomass in real time.
Glucose and lactate show the balance between supply and demand and indicate when perfusion is needed. Glutamine and ammonia track nitrogen metabolism, and their accumulation can inhibit growth. Together they guide feed rates more reliably than scheduled additions.
Related models