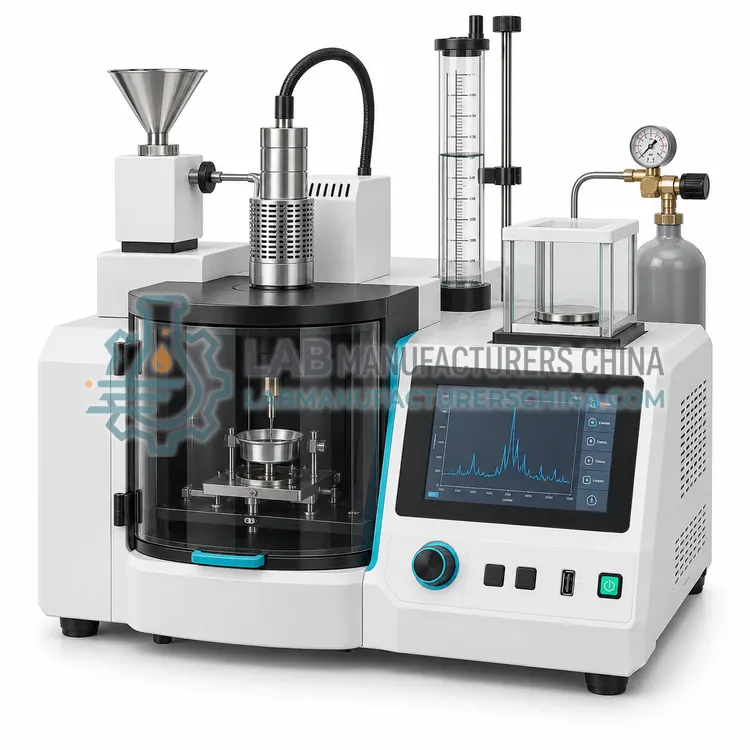
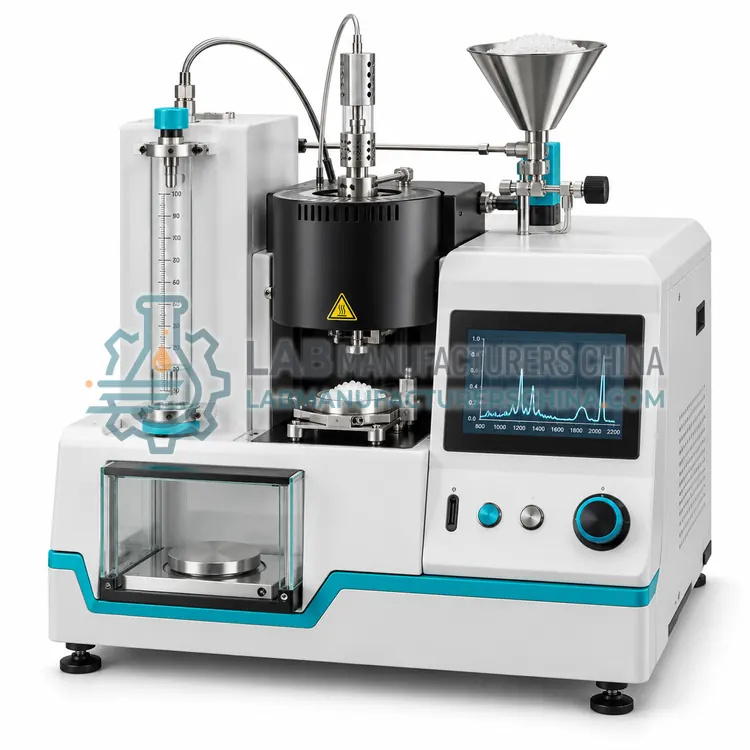
Near-Infrared Spectrometer for Polymer Analysis
聚合物分析用近红外光谱仪
- SKU PSP-0006
- Polymer Spectroscopy
- CE (to be confirmed)
- ISO 9001 manufacturing (to be confirmed)
Price on request — FOB / CIF quoted per order
Prices depend on configuration, quantity and destination port.
Key specifications
| Wavelength range | 780–2500 nm |
|---|---|
| Optical resolution | 2–10 nm |
| Detector | Silicon and indium gallium arsenide |
| Measurement modes | Diffuse reflectance, transmission, interactance |
| Spot size | 2–20 mm depending on probe |
| Scan time | 1–10 s per spectrum |
Request a quote Download brochure · to be provided
By Lab Manufacturers China Technical TeamLast reviewed Standards: ASTM E1252, ASTM E168, ASTM D5576
What is the Near-Infrared Spectrometer for Polymer Analysis?
A near-infrared spectrometer measures weak overtone and combination absorptions that penetrate deeply into polymers, so samples can be screened rapidly without preparation. It is used with chemometric models for identification and for quantitative additive or moisture measurement.
What is the Near-Infrared Spectrometer for Polymer Analysis?
A near-infrared spectrometer measures weak overtone and combination absorptions that penetrate deeply into polymers, so samples can be screened rapidly without preparation. It is used with chemometric models for identification and for quantitative additive or moisture measurement.
Overview
Near-infrared spectroscopy covers roughly 780 to 2500 nm, where absorptions arise from overtones and combinations of fundamental vibrations. Bands are broad and overlapping, so quantification relies on multivariate calibration models rather than on single peaks, and a model must be built and validated for each property and material family. Because penetration depth reaches millimetres in polymers, measurement can be made by diffuse reflectance from granules, powders or extruded strand, or by transmission through thin films and bottles. Fibre-optic probes allow remote or inline measurement, and instruments based on dispersive gratings, Fourier transform or diode arrays differ in speed and robustness. The method is not usually used to identify unknown polymers, for which mid-infrared libraries remain superior.
How does it work?
Molecules absorb infrared radiation at frequencies that match their vibrational modes, so a spectrum of absorbance against wavenumber acts as a fingerprint of the polymer backbone and of the additives present. Fourier-transform instruments use an interferometer and a mathematical transform to record the full spectrum quickly and at high signal-to-noise ratio. Attenuated total reflection brings the beam into a high-refractive-index crystal in contact with the sample, so surface layers of a few micrometres can be measured without preparation. Raman spectroscopy complements this by measuring inelastically scattered light from a laser, which is sensitive to non-polar bonds, and near-infrared spectroscopy records overtone and combination bands that are weak but penetrating, making it suitable for rapid screening through packaging or with fibre probes.
What are the key features?
- Wavelength range from about 780 to 2500 nm
- Diffuse reflectance and transmission modes
- Fibre-optic probes for remote measurement
- Multivariate calibration model support
- Deep penetration allows granule measurement
- Fast scan suitable for high sample volumes
What are the technical specifications?
A typical near-infrared spectrometer for polymer analysis configuration offers wavelength range of 780–2500 nm, optical resolution of 2–10 nm, detector of Silicon and indium gallium arsenide, measurement modes of Diffuse reflectance, transmission, interactance, spot size of 2–20 mm depending on probe and scan time of 1–10 s per spectrum. Values are indicative of the product class; the exact figures for each configuration are confirmed on the quotation and the calibration documents supplied with the instrument.
Which applications is it used for?
The Near-Infrared Spectrometer for Polymer Analysis is used in rapid identification of incoming polymer pellets, moisture measurement in hygroscopic resins, additive and filler content screening and inline film thickness and composition control. Across the wider Polymer Spectroscopy class, laboratories also deploy it for incoming identification of resin and rubber grades, contaminant and gel particle analysis and additive, filler and plasticiser detection.
Which standards and certifications apply?
Relevant standards and methods include ASTM E1252, ASTM E168, ASTM D5576, ASTM D3677, ISO 4650, ASTM E1840 and IEC 61010-1. Certification candidates for this model are CE and ISO 9001 manufacturing; each is to be confirmed for the specific configuration before shipment, and certificates are supplied only where they have been issued.
Keep the spectrometer purged or desiccated because water vapour and carbon dioxide bands appear in the mid-infrared and can mask weak peaks. Run a background scan at the same resolution and purge conditions as the sample, and verify wavenumber calibration with a polystyrene film at defined intervals. For ATR work, clean the crystal immediately after each measurement and check for scratches, because damaged surfaces distort bands. Raman systems should be calibrated against a standard such as silicon or cyclohexane, and laser power must be limited for dark or heat-sensitive polymers to avoid burning the sample.
How do I select the right Near-Infrared Spectrometer for Polymer Analysis?
Choose near-infrared when many samples must be measured quickly, when the property of interest needs a calibration model, or when a fibre-optic probe must reach material inside a machine or container. Confirm that the supplier can supply validated models for your properties and that spiking, temperature and particle-size effects are covered; a model built on one production line rarely transfers to another without revalidation.
How does it compare with other Polymer Spectroscopy variants?
Infrared is the default for polymer identification because spectral libraries are extensive and the method is well standardised. Add an attenuated total reflection accessory when samples are solid, opaque or dirty, since it removes pressing, grinding and solvent steps. Choose an infrared microscope when the target is a contaminant, a gel particle or a multilayer film that must be measured at a defined point or mapped across a surface. Raman is preferred for aqueous samples, for polymers that are strong infrared absorbers such as filled or black materials, and for portable field identification through transparent packaging. Near-infrared is selected for high-throughput screening and quantitative additive or moisture measurement using chemometric models.
Full specifications
| Wavelength range | 780–2500 nm |
|---|---|
| Optical resolution | 2–10 nm |
| Detector | Silicon and indium gallium arsenide |
| Measurement modes | Diffuse reflectance, transmission, interactance |
| Spot size | 2–20 mm depending on probe |
| Scan time | 1–10 s per spectrum |
| Calibration method | Partial least squares regression |
| Probe type | Fibre-optic reflectance or transmission |
| Sample temperature range | 10–60 °C for model validity |
| Power supply | 220 V, 50/60 Hz |
Indicative values for this product class. Final specifications are confirmed on the quotation and in the calibration documents supplied with the instrument.
Applications
- Rapid identification of incoming polymer pellets
- Moisture measurement in hygroscopic resins
- Additive and filler content screening
- Inline film thickness and composition control
Key features
- Wavelength range from about 780 to 2500 nm
- Diffuse reflectance and transmission modes
- Fibre-optic probes for remote measurement
- Multivariate calibration model support
- Deep penetration allows granule measurement
- Fast scan suitable for high sample volumes
Frequently asked questions about Near-Infrared Spectrometer for Polymer Analysis
Near-infrared bands are broad and overlap heavily because they are overtones and combination bands of the fundamental vibrations. A single wavelength normally cannot isolate one component, so multivariate methods such as partial least squares regression are used to relate the whole spectrum to a property measured by a reference method.
Whenever the material, supplier, particle size, temperature range or instrument changes, and periodically as part of routine quality control. Revalidation compares the model prediction with reference results over the expected range and confirms that errors remain within the specification limits agreed for the application.
No. Near-infrared is best for quantitative prediction of properties in materials that are already known or for rapid sorting within a defined set. Mid-infrared spectra have sharper, more characteristic bands and extensive reference libraries, so identification of an unknown polymer is more reliable with mid-infrared.
Infrared spectroscopy is normally the first choice because reference libraries cover the common thermoplastics and rubbers and the method is standardised. Attenuated total reflection makes measurement of a solid part straightforward. Raman is used when the sample is dark, filled, wet or must be identified through packaging, and near-infrared when many samples must be screened rapidly.
ATR needs no KBr pressing, no grinding and no solvent, so an irregular part, a pellet or a film can be measured in seconds with good contact. The beam penetrates only a few micrometres, which means surface contamination dominates the spectrum, so the surface should be representative or cleaned before measurement.
The measured spectrum is searched against a library using correlation or hit-quality algorithms that compare peak positions and relative intensities. Results are reported as a ranked list with a match score, and identification should be confirmed by checking the key diagnostic bands of the proposed polymer rather than relying on the score alone.
Related models