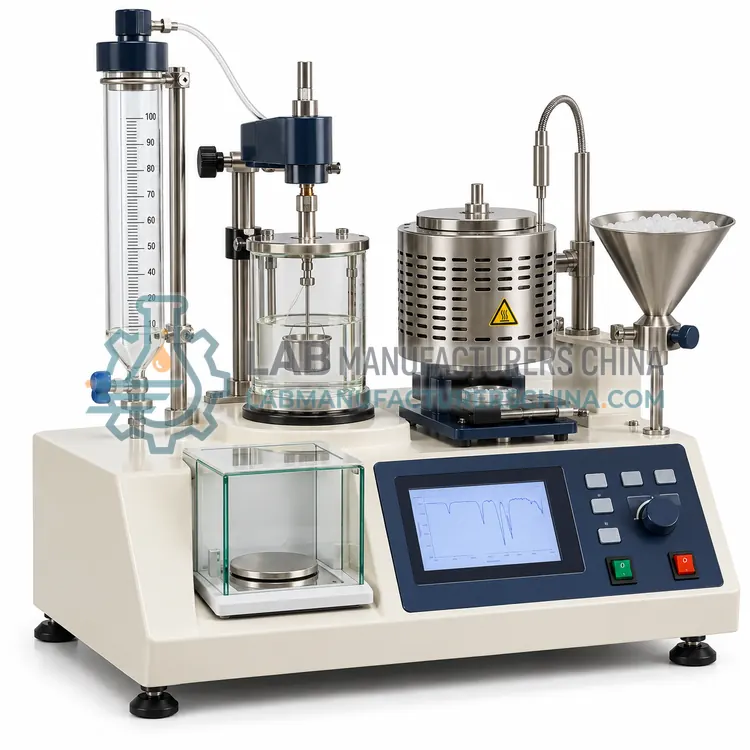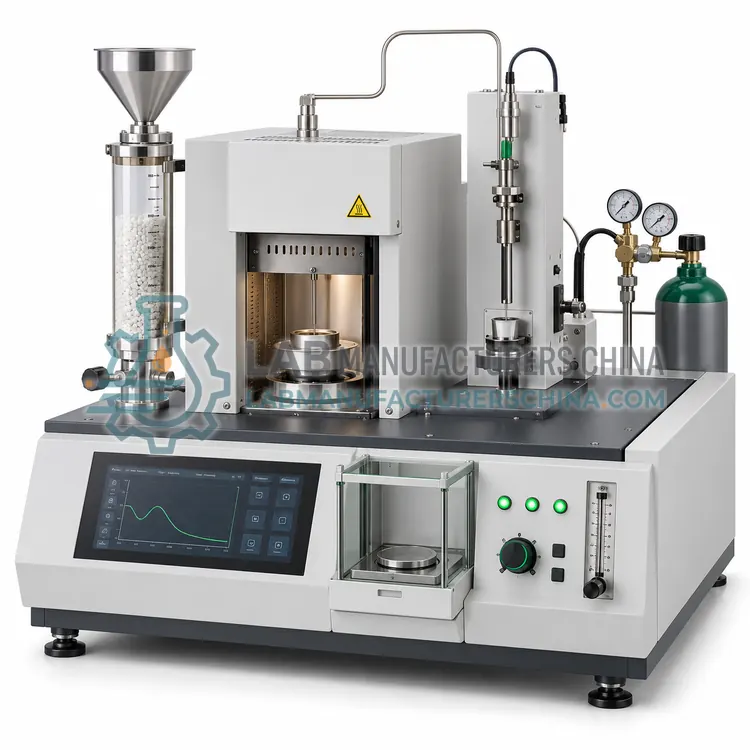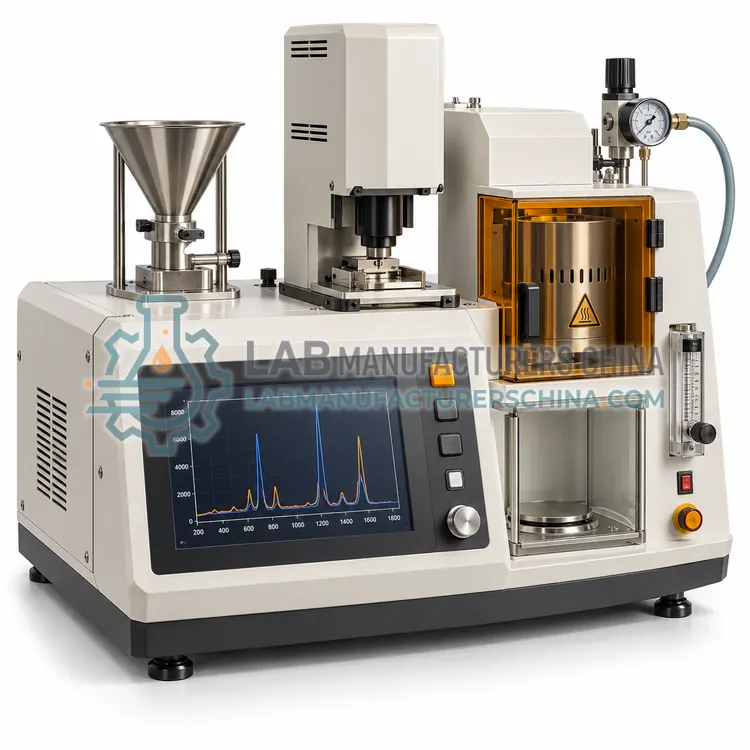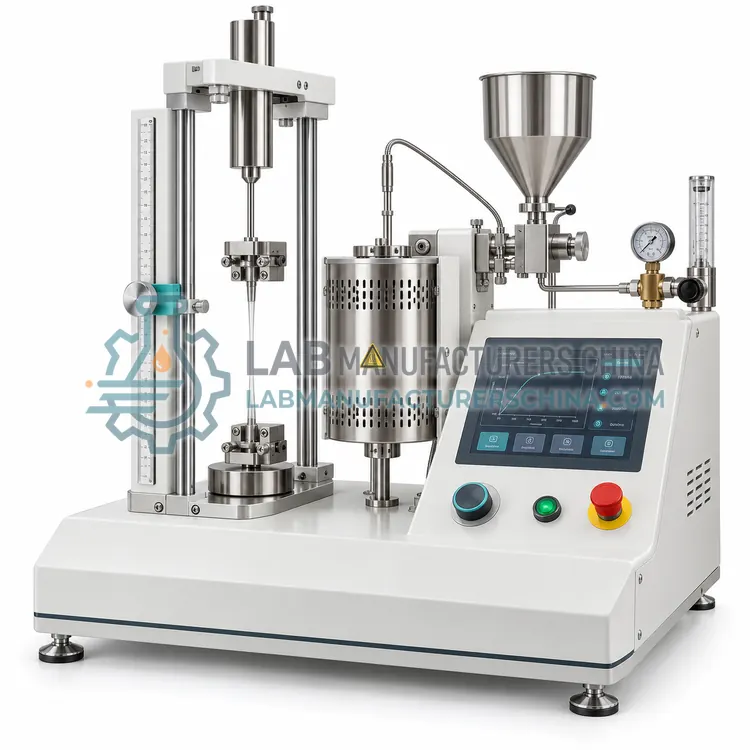
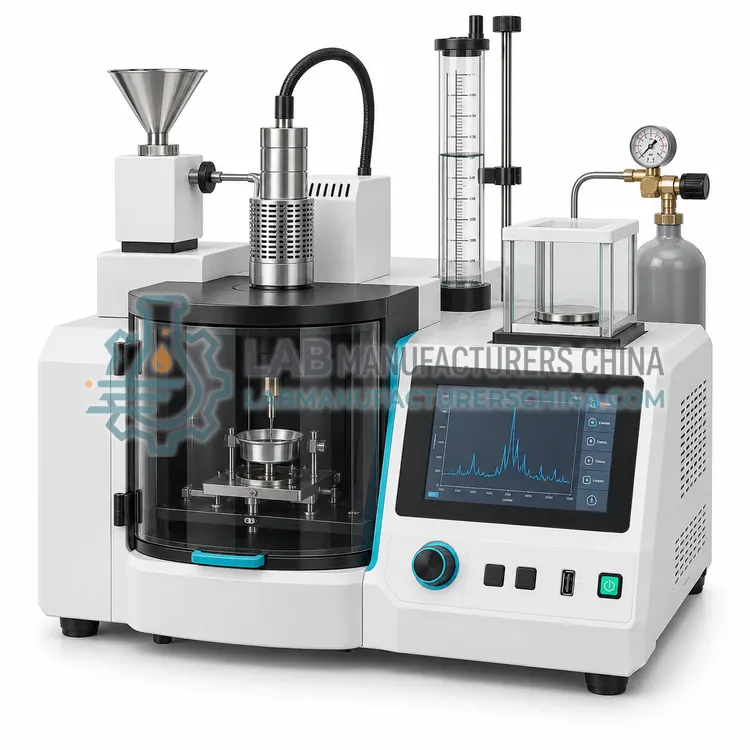
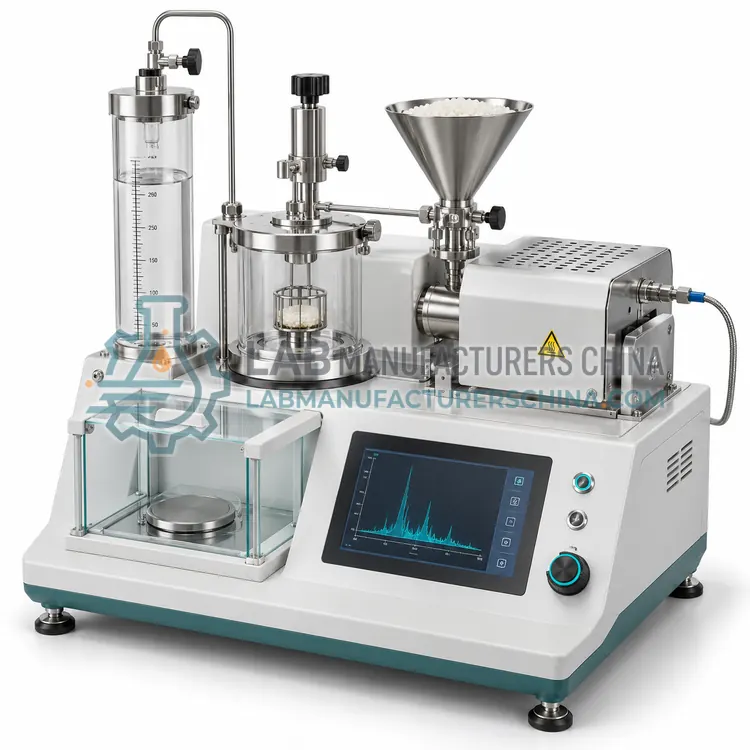
Raman Spectrometer for Polymer Characterization
聚合物表征用拉曼光谱仪
- SKU PSP-0004
- Polymer Spectroscopy
- CE (to be confirmed)
- ISO 9001 manufacturing (to be confirmed)
- IEC 61010-1 safety compliance (to be confirmed)
Price on request — FOB / CIF quoted per order
Prices depend on configuration, quantity and destination port.
Key specifications
| Laser wavelengths | 532 nm, 785 nm, 1064 nm options |
|---|---|
| Spectral range | 100–4000 cm⁻¹ |
| Spectral resolution | 4–8 cm⁻¹ |
| Detector | TE-cooled CCD or InGaAs array |
| Laser power at sample | 1–500 mW, adjustable |
| Depth profiling | Confocal, 1–2 µm steps |
Request a quote Download brochure · to be provided
By Lab Manufacturers China Technical TeamLast reviewed Standards: ASTM E1252, ASTM E168, ASTM D5576
What is the Raman Spectrometer for Polymer Characterization?
A bench Raman spectrometer measures inelastically scattered laser light to characterise polymer structure, crystallinity and additives, and works well for dark, filled or aqueous samples that are difficult for infrared. It provides complementary information to infrared analysis.
What is the Raman Spectrometer for Polymer Characterization?
A bench Raman spectrometer measures inelastically scattered laser light to characterise polymer structure, crystallinity and additives, and works well for dark, filled or aqueous samples that are difficult for infrared. It provides complementary information to infrared analysis.
Overview
A Raman spectrometer illuminates the sample with a monochromatic laser, usually at 532, 785 or 1064 nm, and measures the small shift in scattered light caused by molecular vibrations. Sensitivity to non-polar bonds such as carbon-carbon and sulfur-sulfur makes the technique complementary to infrared, and water is a weak Raman scatterer, so aqueous and humid samples can be measured. Confocal optics allow depth profiling through transparent layers, and polarisation control provides orientation information in drawn fibres and films. Because the laser can heat or burn dark samples, power is adjusted or the sample is rotated. Advantages include minimal sample preparation and measurement through glass or plastic packaging, while fluorescence from additives or impurities remains the main limitation.
How does it work?
Molecules absorb infrared radiation at frequencies that match their vibrational modes, so a spectrum of absorbance against wavenumber acts as a fingerprint of the polymer backbone and of the additives present. Fourier-transform instruments use an interferometer and a mathematical transform to record the full spectrum quickly and at high signal-to-noise ratio. Attenuated total reflection brings the beam into a high-refractive-index crystal in contact with the sample, so surface layers of a few micrometres can be measured without preparation. Raman spectroscopy complements this by measuring inelastically scattered light from a laser, which is sensitive to non-polar bonds, and near-infrared spectroscopy records overtone and combination bands that are weak but penetrating, making it suitable for rapid screening through packaging or with fibre probes.
What are the key features?
- Laser wavelengths of 532, 785 and 1064 nm
- Confocal depth profiling of transparent layers
- Polarised measurement for orientation studies
- Minimal sample preparation requirement
- Measurement through glass and plastic packaging
- Silicon reference for wavenumber calibration
What are the technical specifications?
A typical raman spectrometer for polymer characterization configuration offers laser wavelengths of 532 nm, 785 nm, 1064 nm options, spectral range of 100–4000 cm⁻¹, spectral resolution of 4–8 cm⁻¹, detector of TE-cooled CCD or InGaAs array, laser power at sample of 1–500 mW, adjustable and depth profiling of Confocal, 1–2 µm steps. Values are indicative of the product class; the exact figures for each configuration are confirmed on the quotation and the calibration documents supplied with the instrument.
Which applications is it used for?
The Raman Spectrometer for Polymer Characterization is used in crystallinity and polymorph studies of polymers, filled and dark compound identification, orientation analysis in drawn fibres and films, carbon-based filler identification and contaminant analysis in aqueous environments. Across the wider Polymer Spectroscopy class, laboratories also deploy it for incoming identification of resin and rubber grades, contaminant and gel particle analysis and additive, filler and plasticiser detection.
Which standards and certifications apply?
Relevant standards and methods include ASTM E1252, ASTM E168, ASTM D5576, ASTM D3677, ISO 4650, ASTM E1840 and IEC 61010-1. Certification candidates for this model are CE, ISO 9001 manufacturing and IEC 61010-1 safety compliance; each is to be confirmed for the specific configuration before shipment, and certificates are supplied only where they have been issued.
Keep the spectrometer purged or desiccated because water vapour and carbon dioxide bands appear in the mid-infrared and can mask weak peaks. Run a background scan at the same resolution and purge conditions as the sample, and verify wavenumber calibration with a polystyrene film at defined intervals. For ATR work, clean the crystal immediately after each measurement and check for scratches, because damaged surfaces distort bands. Raman systems should be calibrated against a standard such as silicon or cyclohexane, and laser power must be limited for dark or heat-sensitive polymers to avoid burning the sample.
How do I select the right Raman Spectrometer for Polymer Characterization?
Choose Raman when infrared spectra are difficult to obtain or uninformative, as with carbon-black-filled rubbers, dark compounds, wet samples or specimens inside transparent packaging. Select the laser wavelength from the fluorescence behaviour of your materials, since near-infrared excitation reduces fluorescence but weakens the signal, and confirm whether depth profiling or polarised measurement is required.
How does it compare with other Polymer Spectroscopy variants?
Infrared is the default for polymer identification because spectral libraries are extensive and the method is well standardised. Add an attenuated total reflection accessory when samples are solid, opaque or dirty, since it removes pressing, grinding and solvent steps. Choose an infrared microscope when the target is a contaminant, a gel particle or a multilayer film that must be measured at a defined point or mapped across a surface. Raman is preferred for aqueous samples, for polymers that are strong infrared absorbers such as filled or black materials, and for portable field identification through transparent packaging. Near-infrared is selected for high-throughput screening and quantitative additive or moisture measurement using chemometric models.
Full specifications
| Laser wavelengths | 532 nm, 785 nm, 1064 nm options |
|---|---|
| Spectral range | 100–4000 cm⁻¹ |
| Spectral resolution | 4–8 cm⁻¹ |
| Detector | TE-cooled CCD or InGaAs array |
| Laser power at sample | 1–500 mW, adjustable |
| Depth profiling | Confocal, 1–2 µm steps |
| Wavenumber accuracy | ±1 cm⁻¹, silicon reference |
| Sample observation | Integrated optical microscope with camera |
| Fluorescence control | 1064 nm option or sample rotation |
| Power supply | 220 V, 50/60 Hz |
Indicative values for this product class. Final specifications are confirmed on the quotation and in the calibration documents supplied with the instrument.
Applications
- Crystallinity and polymorph studies of polymers
- Filled and dark compound identification
- Orientation analysis in drawn fibres and films
- Carbon-based filler identification
- Contaminant analysis in aqueous environments
Key features
- Laser wavelengths of 532, 785 and 1064 nm
- Confocal depth profiling of transparent layers
- Polarised measurement for orientation studies
- Minimal sample preparation requirement
- Measurement through glass and plastic packaging
- Silicon reference for wavenumber calibration
Frequently asked questions about Raman Spectrometer for Polymer Characterization
Infrared absorption depends on a change in dipole moment during vibration, while Raman scattering depends on a change in polarisability. Bonds such as carbon-carbon, sulfur-sulfur and carbon-sulfur are strong Raman scatterers but weak infrared absorbers, so a material that gives a poor infrared spectrum may give an excellent Raman spectrum.
Fluorescence from additives, impurities or the polymer itself can swamp the Raman signal. Practical measures are to use a longer excitation wavelength such as 785 or 1064 nm, to reduce laser power and average more scans, to photobleach the sample with pre-illumination, or to use confocal depth profiling to avoid a fluorescent surface layer.
It can indicate it. Crystalline and amorphous phases give different band positions, widths and intensity ratios, so empirical correlations are used to estimate crystallinity, often after calibration with X-ray diffraction or density data. For specification purposes the correlation must be established and validated for each polymer family.
Infrared spectroscopy is normally the first choice because reference libraries cover the common thermoplastics and rubbers and the method is standardised. Attenuated total reflection makes measurement of a solid part straightforward. Raman is used when the sample is dark, filled, wet or must be identified through packaging, and near-infrared when many samples must be screened rapidly.
ATR needs no KBr pressing, no grinding and no solvent, so an irregular part, a pellet or a film can be measured in seconds with good contact. The beam penetrates only a few micrometres, which means surface contamination dominates the spectrum, so the surface should be representative or cleaned before measurement.
The measured spectrum is searched against a library using correlation or hit-quality algorithms that compare peak positions and relative intensities. Results are reported as a ranked list with a match score, and identification should be confirmed by checking the key diagnostic bands of the proposed polymer rather than relying on the score alone.