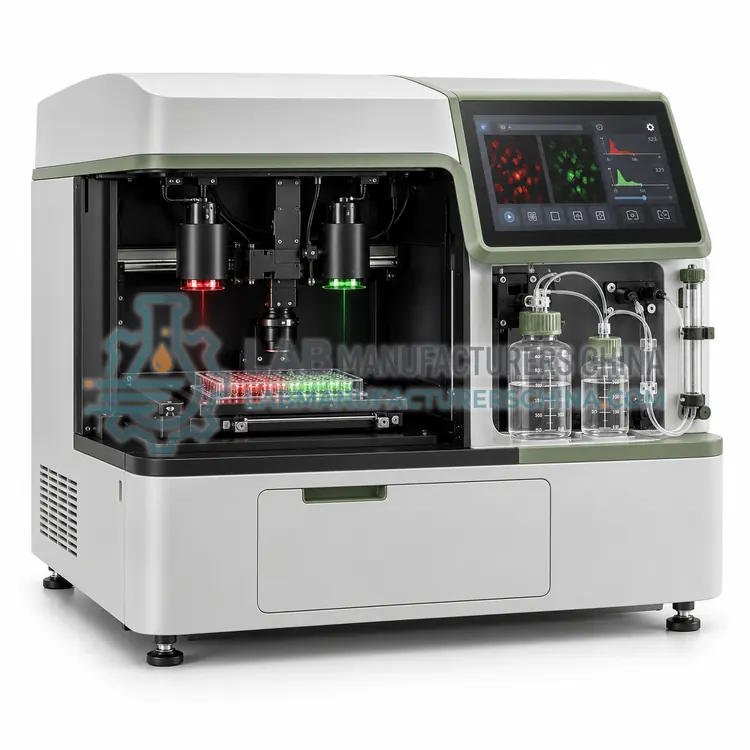
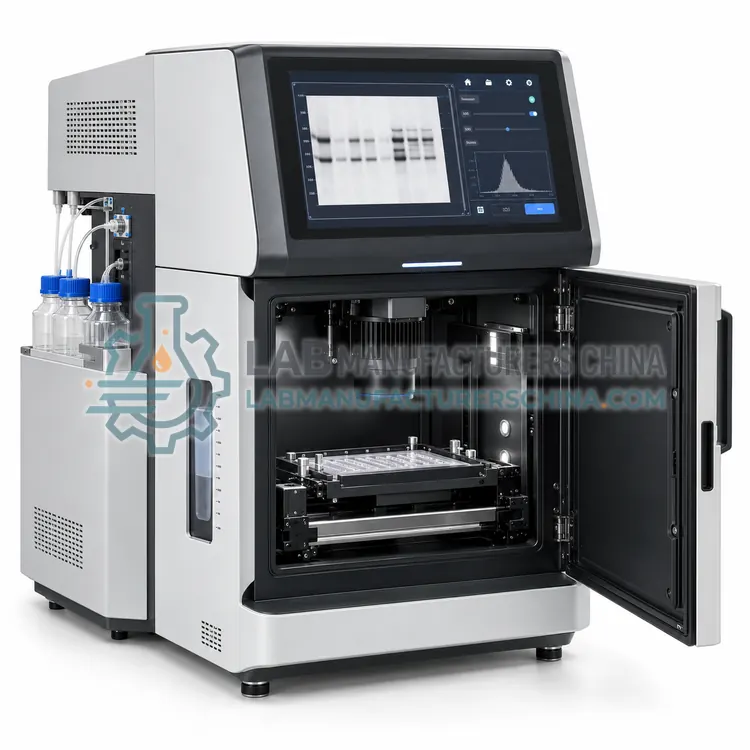
Automated Chemiluminescence Imaging System
自动化学发光成像系统
- SKU PRI-0001
- Protein Imaging
- CE (to be confirmed)
- ISO 9001 manufacturing (to be confirmed)
- IEC 61010-1 safety (to be confirmed)
Price on request — FOB / CIF quoted per order
Prices depend on configuration, quantity and destination port.
Key specifications
| Sensor | Cooled CCD or CMOS, approx. 4–16 MP |
|---|---|
| Cooling temperature | approx. −25 to −60 °C |
| Dynamic range | approx. 3–4 orders of magnitude |
| Detection limit | low picogram range of protein per band |
| Exposure time | 0.1 s to 60 min, automatic or manual |
| Imaging area | approx. 150 x 150 mm |
Request a quote Download brochure · to be provided
By Lab Manufacturers China Technical TeamLast reviewed Standards: USP <1057>, Ph. Eur. 2.2.31, IEC 61010-1
What is the Automated Chemiluminescence Imaging System?
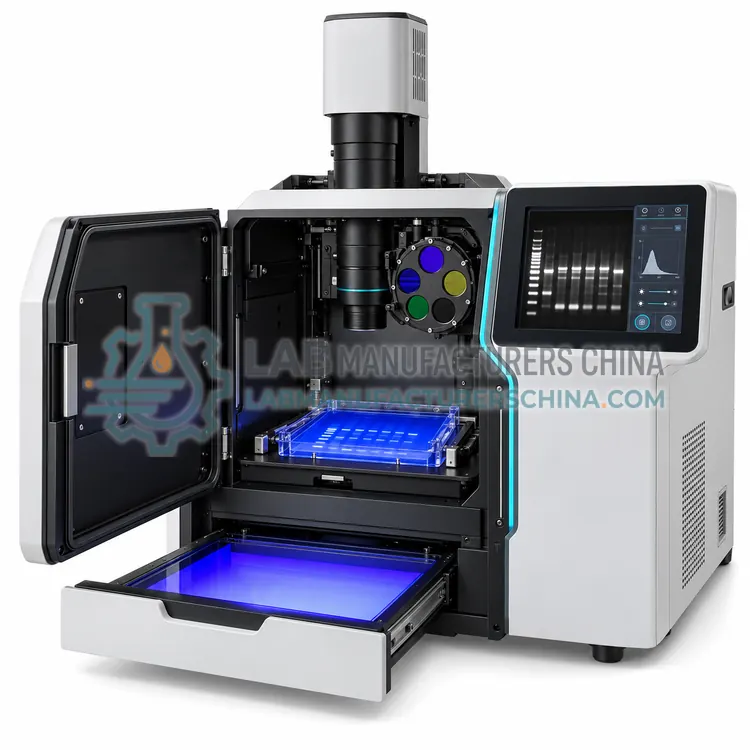
An automated chemiluminescence imaging system uses a cooled CCD or CMOS sensor to capture the light emitted by enzyme-labelled blots without any excitation source, giving high sensitivity and low background for routine western blot quantification.
What is the Automated Chemiluminescence Imaging System?
An automated chemiluminescence imaging system uses a cooled CCD or CMOS sensor to capture the light emitted by enzyme-labelled blots without any excitation source, giving high sensitivity and low background for routine western blot quantification.
Overview
The instrument places the membrane inside a dark enclosure and integrates the faint emission from a chemiluminescent substrate over exposures of seconds to several minutes. A sensor cooled to −25 °C or below reduces dark current, which is the main limit on sensitivity for long integrations. Exposure control can be automatic, with the software choosing a time that keeps the strongest band below saturation, and many systems collect a series of exposures so the user can select the linear image. Dynamic range is typically three to four orders of magnitude, which allows strong and weak bands on the same blot to be measured. Software provides background subtraction, lane profiling, molecular weight assignment against a ladder and export of band intensity tables for spreadsheets or electronic records.
How does it work?
Imaging systems convert a signal on a membrane or gel surface into a calibrated digital image. In chemiluminescence imaging, no excitation light is needed: an enzyme such as horseradish peroxidase converts a substrate into an excited product that emits light, and a cooled CCD or CMOS sensor integrates that faint emission over minutes. Fluorescence imaging instead excites fluorophores with LEDs or lasers and collects emitted light through bandpass filters, which allows multiplexing with differently labelled antibodies. Colorimetric systems use white or coloured illumination and measure transmitted or reflected light to quantify stained bands such as Coomassie blue. Laser scanning instruments move a focused beam across the surface and record point by point, which gives high spatial resolution and a wide linear dynamic range. In all cases the software subtracts background, converts pixel intensities to optical density, and compares bands with a standard or loading control.
What are the key features?
- Cooled CCD or CMOS sensor to −25 °C or below
- Automatic exposure selection with saturation avoidance
- Multiple exposure capture for linear range selection
- Background subtraction and lane profiling software
- Molecular weight assignment against a visible ladder
- Band intensity tables exported to spreadsheet formats
What are the technical specifications?
A typical automated chemiluminescence imaging system configuration offers sensor of Cooled CCD or CMOS, approx. 4–16 MP, cooling temperature of approx. −25 to −60 °C, dynamic range of approx. 3–4 orders of magnitude, detection limit of low picogram range of protein per band, exposure time of 0.1 s to 60 min, automatic or manual and imaging area of approx. 150 x 150 mm. Values are indicative of the product class; the exact figures for each configuration are confirmed on the quotation and the calibration documents supplied with the instrument.
Which applications is it used for?
The Automated Chemiluminescence Imaging System is used in routine western blot band quantification, phosphoprotein and signalling analysis, biopharmaceutical purity documentation and reproducible comparison of treatment groups. Across the wider Protein Imaging class, laboratories also deploy it for western blot band quantification, protein purity assessment from stained gels and multiplexed fluorescence immunodetection.
Which standards and certifications apply?
Relevant standards and methods include USP <1057>, Ph. Eur. 2.2.31, IEC 61010-1, ISO 17025, 21 CFR Part 11 and ISO 9001. Certification candidates for this model are CE, ISO 9001 manufacturing and IEC 61010-1 safety; each is to be confirmed for the specific configuration before shipment, and certificates are supplied only where they have been issued.
Keep the imaging area clean and free of dust, because particles scatter light and appear as false bands. Avoid saturating the sensor, since saturated pixels cannot be used for quantification; most software flags them, and exposure series should be used to confirm the signal is in the linear range. Chemiluminescent substrates decay within minutes to an hour, so imaging should follow the supplier's timing recommendation and be consistent between samples. Fluorescent blots fade with repeated exposure, so images should be captured once where possible. Calibrate the instrument periodically with a step tablet or fluorescence standard and record the settings used, so that images from different sessions remain comparable. Archive raw files, not only processed figures, because quantitative results may need re-analysis.
How do I select the right Automated Chemiluminescence Imaging System?
Select a chemiluminescence imaging system for enzyme-based western blots where sensitivity and low background matter most. Specify sensor type and cooling temperature, pixel resolution, dynamic range, imaging area, exposure control and the analysis and export features of the software.
How does it compare with other Protein Imaging variants?
Choose the detector that matches your detection chemistry. Chemiluminescence needs a cooled sensor with low dark current and long integration times, and absolute sensitivity matters more than resolution. Fluorescence needs matched excitation sources and emission filters, and filter selection should cover the dyes you actually use, including near-infrared pairs for low-background multiplexing. Colorimetric and densitometry work needs uniform illumination and colour calibration to make Coomassie or silver staining quantitative. Laser scanning suits applications where a wide linear dynamic range and high resolution are essential, such as purity determination with small impurity peaks. Check the camera or scanner resolution in millimetres per pixel, dynamic range in orders of magnitude, cooling temperature, imaging area, light source lifetime and whether the software supports background subtraction, saturation warnings, lane profiling and export of numerical data.
Full specifications
| Sensor | Cooled CCD or CMOS, approx. 4–16 MP |
|---|---|
| Cooling temperature | approx. −25 to −60 °C |
| Dynamic range | approx. 3–4 orders of magnitude |
| Detection limit | low picogram range of protein per band |
| Exposure time | 0.1 s to 60 min, automatic or manual |
| Imaging area | approx. 150 x 150 mm |
| Resolution | approx. 0.02–0.1 mm per pixel |
| Illumination | White epi and transillumination for colour markers |
| Software | Background subtraction, lane profiling, report export |
| Dimensions (W x D x H) | approx. 400 x 450 x 400 mm |
Indicative values for this product class. Final specifications are confirmed on the quotation and in the calibration documents supplied with the instrument.
Applications
- Routine western blot band quantification
- Phosphoprotein and signalling analysis
- Biopharmaceutical purity documentation
- Reproducible comparison of treatment groups
Key features
- Cooled CCD or CMOS sensor to −25 °C or below
- Automatic exposure selection with saturation avoidance
- Multiple exposure capture for linear range selection
- Background subtraction and lane profiling software
- Molecular weight assignment against a visible ladder
- Band intensity tables exported to spreadsheet formats
Frequently asked questions about Automated Chemiluminescence Imaging System
Exposure depends on signal strength and commonly ranges from a few seconds for strong bands to several minutes for weak ones. Capture a series, then choose the image where the strongest band is just below saturation for quantification.
Cooling reduces dark current, the thermally generated noise that accumulates during long exposures. Without cooling, faint chemiluminescent signals would be buried in noise, so cooled sensors are essential for picogram-level detection.
Yes, if the instrument has white epi or transillumination. Pre-stained markers are recorded in a colour image with the illumination on, and the chemiluminescent signal is captured separately with the light off, allowing markers to be merged with the blot image.
Chemiluminescence needs no excitation light, so background is low and sensitivity high, but only one target can be detected at a time. Fluorescence excites labelled probes with LEDs or lasers, enabling multiplexing with different dyes, at the cost of higher autofluorescence and more careful filter selection.
Capture a series of exposures at different times or gains and check whether band intensity increases proportionally. If a band stops increasing, pixels are saturated. Software saturation warnings and a reference band with known relative intensity also help confirm linearity.
Coomassie and fluorescent stains can be quantified if the same gel, stain lot, destaining protocol and imaging settings are used, and the signal is within the linear range. Silver staining is generally considered semiquantitative because of its non-linear response.
Related models