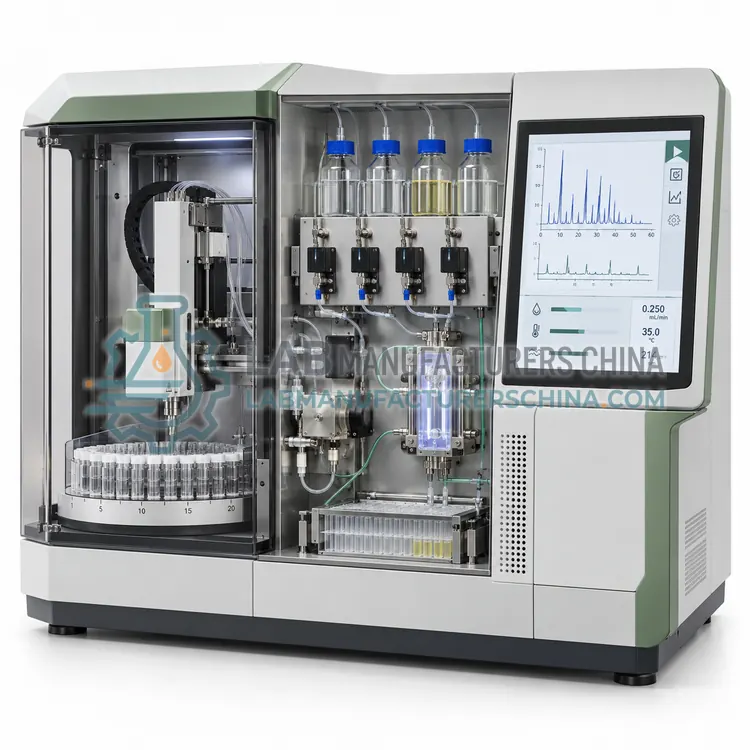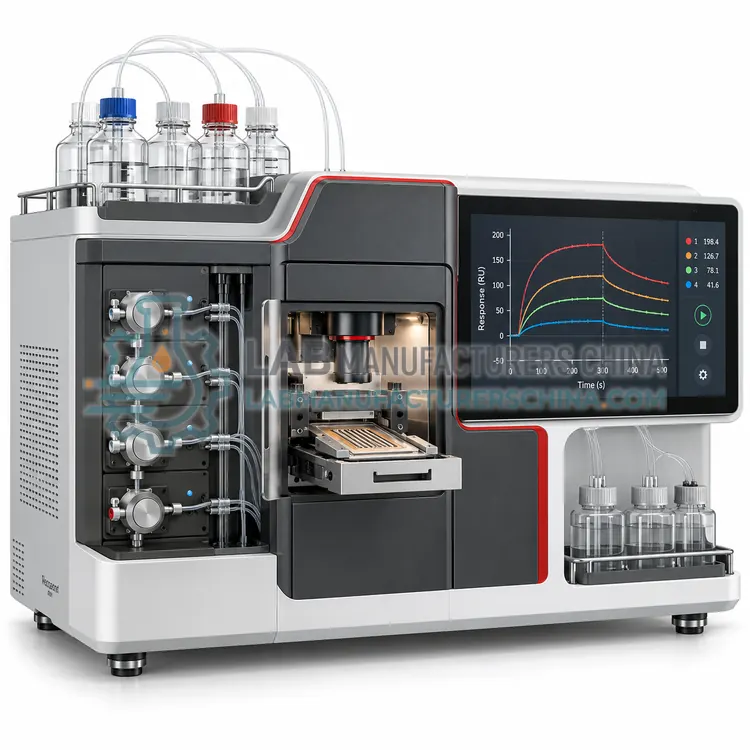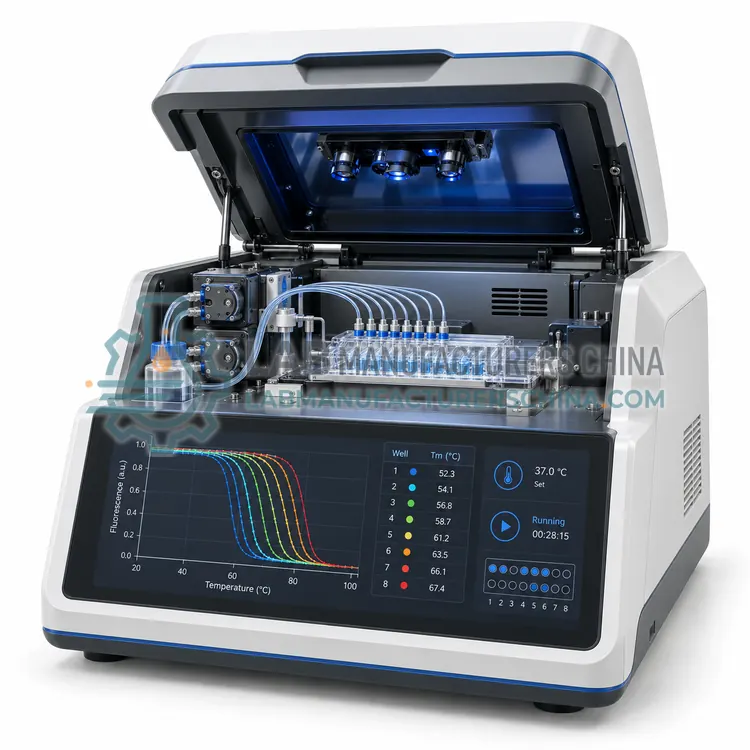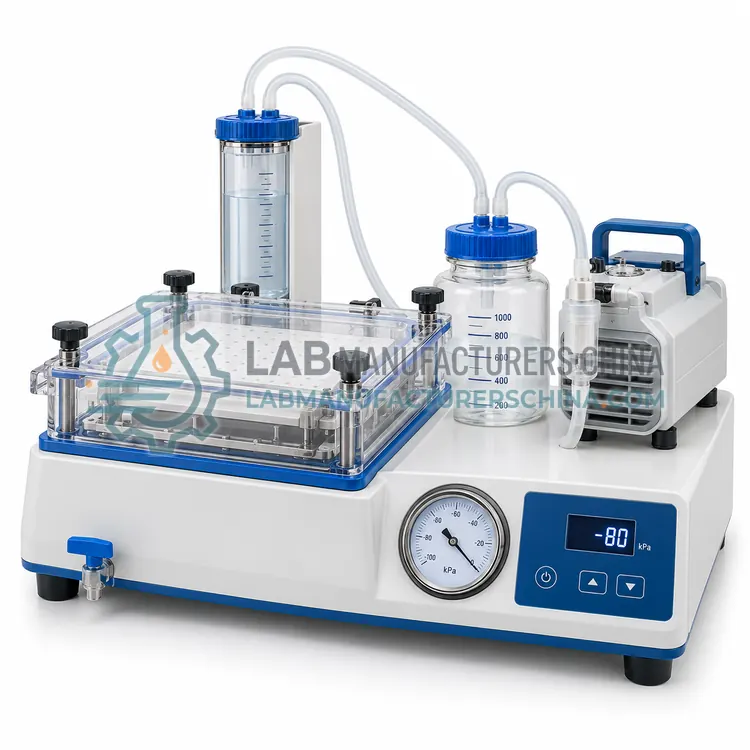
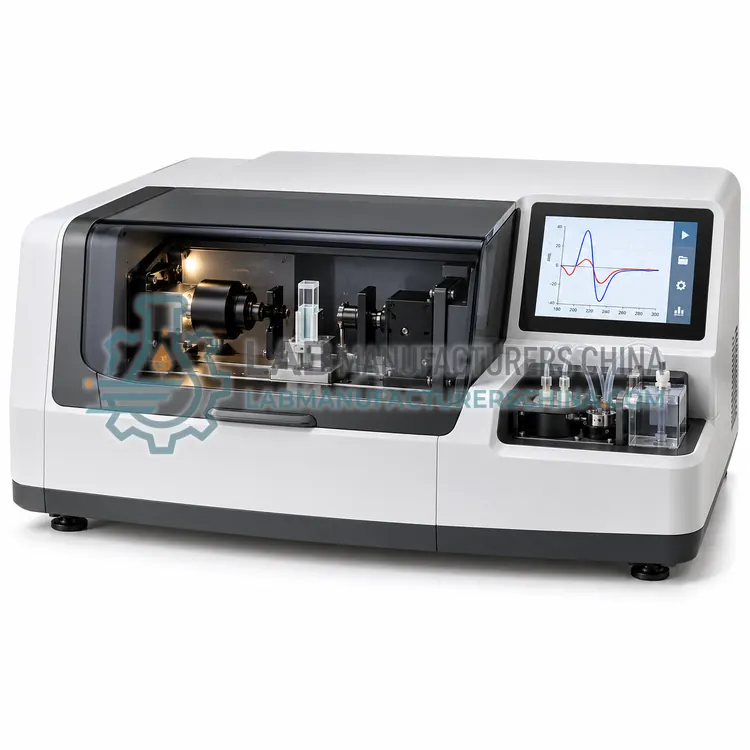
Circular Dichroism Spectrometer
圆二色光谱仪
- SKU PAN-0003
- Protein Analyzers
- CE (to be confirmed)
- ISO 9001 manufacturing (to be confirmed)
- IEC 61010-1 safety (to be confirmed)
Price on request — FOB / CIF quoted per order
Prices depend on configuration, quantity and destination port.
Key specifications
| Wavelength range | approx. 175–800 nm |
|---|---|
| Bandwidth | 1–2 nm (typical) |
| Sample concentration | 0.1–1 mg/mL in a 0.1 cm cell |
| Cell path length | 0.01–10 mm available |
| Temperature range | approx. 5–95 °C with Peltier control |
| Temperature accuracy | within ±0.2 °C (typical) |
Request a quote Download brochure · to be provided
By Lab Manufacturers China Technical TeamLast reviewed Standards: USP <1057>, Ph. Eur. 2.2.56, Ph. Eur. 2.2.25
What is the Circular Dichroism Spectrometer?
A circular dichroism spectrometer measures the difference in absorption of left- and right-circularly polarised light to report protein secondary structure, folding state and thermal unfolding. It compares conformation between batches and detects changes caused by formulation or mutation.
What is the Circular Dichroism Spectrometer?
A circular dichroism spectrometer measures the difference in absorption of left- and right-circularly polarised light to report protein secondary structure, folding state and thermal unfolding. It compares conformation between batches and detects changes caused by formulation or mutation.
Overview
The instrument passes monochromatic light through a photoelastic modulator that alternates between left and right circular polarisation, and a photomultiplier records the small difference in absorbance of the sample. The far-UV spectrum from about 190 to 260 nm reflects the peptide backbone, with alpha helix giving minima near 208 and 222 nm, beta sheet near 218 nm and disordered structure near 200 nm. Software deconvolutes the spectrum into structural fractions, and thermal ramps at a single wavelength give a melting curve and midpoint temperature. Sample requirements are modest, typically 200–400 µL at 0.2–0.5 mg/mL in a 0.1 cm cell. Nitrogen purging is required below 200 nm to remove oxygen that absorbs in the far UV, and low-absorbing buffers such as phosphate or borate are preferred.
How does it work?
Protein analyzers apply a physical or chemical measurement that responds to a specific property of the molecule. Amino acid analysis hydrolyses the protein and separates the released amino acids by ion exchange or reversed-phase chromatography with ninhydrin or fluorescence detection, giving composition in residues per molecule. Edman degradation removes one amino acid at a time from the N-terminus by phenylisothiocyanate chemistry and identifies each derivative chromatographically, giving the first 20–50 residues. Circular dichroism measures the difference in absorption of left- and right-circularly polarised light, and the far-UV spectrum reports alpha helix, beta sheet and random coil content. Thermal shift assays use a fluorescent dye that reports unfolding as temperature rises, giving a melting temperature that shifts when a ligand binds. Surface plasmon resonance detects mass binding at a sensor surface in real time, yielding association and dissociation rate constants.
What are the key features?
- Far-UV spectra from about 190 to 260 nm for secondary structure
- Peltier temperature control for thermal unfolding and refolding studies
- Spectrum deconvolution software reporting helix, sheet and coil fractions
- Melting temperature determination at a fixed wavelength
- Stopped-flow or titration options for kinetic measurements
- Nitrogen purge control with wavelength range below 200 nm
What are the technical specifications?
A typical circular dichroism spectrometer configuration offers wavelength range of approx. 175–800 nm, bandwidth of 1–2 nm (typical), sample concentration of 0.1–1 mg/mL in a 0.1 cm cell, cell path length of 0.01–10 mm available, temperature range of approx. 5–95 °C with Peltier control and temperature accuracy of within ±0.2 °C (typical). Values are indicative of the product class; the exact figures for each configuration are confirmed on the quotation and the calibration documents supplied with the instrument.
Which applications is it used for?
The Circular Dichroism Spectrometer is used in batch-to-batch conformational comparability, thermal stability and unfolding studies, formulation and buffer screening and protein folding and mutation impact research. Across the wider Protein Analyzers class, laboratories also deploy it for recombinant protein characterisation, biosimilar comparability studies and protein structure and folding research.
Which standards and certifications apply?
Relevant standards and methods include USP <1057>, Ph. Eur. 2.2.56, Ph. Eur. 2.2.25, ISO 17025, IEC 61010-1 and 21 CFR Part 11. Certification candidates for this model are CE, ISO 9001 manufacturing and IEC 61010-1 safety; each is to be confirmed for the specific configuration before shipment, and certificates are supplied only where they have been issued.
Sample purity and buffer composition dominate results, so prepare proteins in volatile, low-absorbing buffers for circular dichroism and avoid detergents and reducing agents that absorb in the far UV. Amino acid analysis needs complete hydrolysis, so ampoule sealing, vacuum and hydrolysis time must be controlled. Surface plasmon resonance sensors are sensitive to buffer refractive index differences, so running buffer and sample buffer should match and a reference channel should be included. Thermal shift assays need consistent dye concentration and controlled heating rates. Verify performance periodically with a reference protein such as bovine serum albumin or lysozyme, keep maintenance and calibration records, and store raw data, since circular dichroism and biosensor results are often re-analysed after method changes.
How do I select the right Circular Dichroism Spectrometer?
Select a circular dichroism spectrometer when secondary structure and thermal stability must be compared between samples or batches. Specify wavelength range, bandwidth, temperature control range, cell path length options, nitrogen purge requirement and the deconvolution software included.
How does it compare with other Protein Analyzers variants?
Choose the analyzer that measures the property you must document. For composition or identity of a purified protein, amino acid analysis gives a quantitative profile; Edman sequencing provides N-terminal sequence but needs a pure, unblocked sample. Circular dichroism is the standard method for secondary structure comparison between batches and for folding studies, and it needs only 0.2–0.5 mg/mL in a low-absorbing buffer. Thermal shift assays screen buffer conditions and ligand binding quickly in 96-well format, making them useful early in development. Surface plasmon resonance quantifies affinity and kinetics, and it demands careful immobilisation chemistry and reference channel design. Compare sample consumption, sensitivity, throughput, buffer tolerance, temperature control and whether the software can export raw traces for independent analysis.
Full specifications
| Wavelength range | approx. 175–800 nm |
|---|---|
| Bandwidth | 1–2 nm (typical) |
| Sample concentration | 0.1–1 mg/mL in a 0.1 cm cell |
| Cell path length | 0.01–10 mm available |
| Temperature range | approx. 5–95 °C with Peltier control |
| Temperature accuracy | within ±0.2 °C (typical) |
| Scan speed | 10–200 nm/min |
| Nitrogen purge | Required for wavelengths below 200 nm |
| Detection | Photoelastic modulator with photomultiplier |
| Dimensions (W x D x H) | approx. 600 x 500 x 350 mm |
Indicative values for this product class. Final specifications are confirmed on the quotation and in the calibration documents supplied with the instrument.
Applications
- Batch-to-batch conformational comparability
- Thermal stability and unfolding studies
- Formulation and buffer screening
- Protein folding and mutation impact research
Key features
- Far-UV spectra from about 190 to 260 nm for secondary structure
- Peltier temperature control for thermal unfolding and refolding studies
- Spectrum deconvolution software reporting helix, sheet and coil fractions
- Melting temperature determination at a fixed wavelength
- Stopped-flow or titration options for kinetic measurements
- Nitrogen purge control with wavelength range below 200 nm
Frequently asked questions about Circular Dichroism Spectrometer
It reflects the peptide backbone conformation. Minima near 208 and 222 nm indicate alpha helix, a single minimum near 218 nm indicates beta sheet, and a minimum near 200 nm indicates disordered structure. Deconvolution software estimates the proportion of each.
Oxygen in air absorbs strongly in the far UV and would mask the sample signal below about 200 nm. Purging the optics with dry nitrogen removes it, protects the optics from ozone and allows measurement down to 190 nm or lower.
No. It reports the average secondary structure content of the protein in solution, not a three-dimensional model. Results are best used for comparison between samples, while nuclear magnetic resonance or crystallography provides atomic-level structure.
For composition, amino acid analysis gives a quantitative residue profile. For N-terminal sequence, Edman sequencing identifies the first 20–50 residues but requires a pure sample with a free N-terminus. Mass spectrometry is usually added for molecular weight confirmation.
A typical far-UV measurement uses 200–400 µL of sample at 0.2–0.5 mg/mL in a 0.1 cm cuvette, which is about 40–200 µg of protein. Lower concentrations are possible with longer path length cells, but buffer absorbance then limits the usable wavelength range.
It reports the temperature at which half the protein unfolds in a given buffer. Comparing melting temperatures across conditions ranks buffer stability, and a shift to higher temperature on adding a ligand indicates binding, which makes the method useful for screening before more detailed studies.
Related models