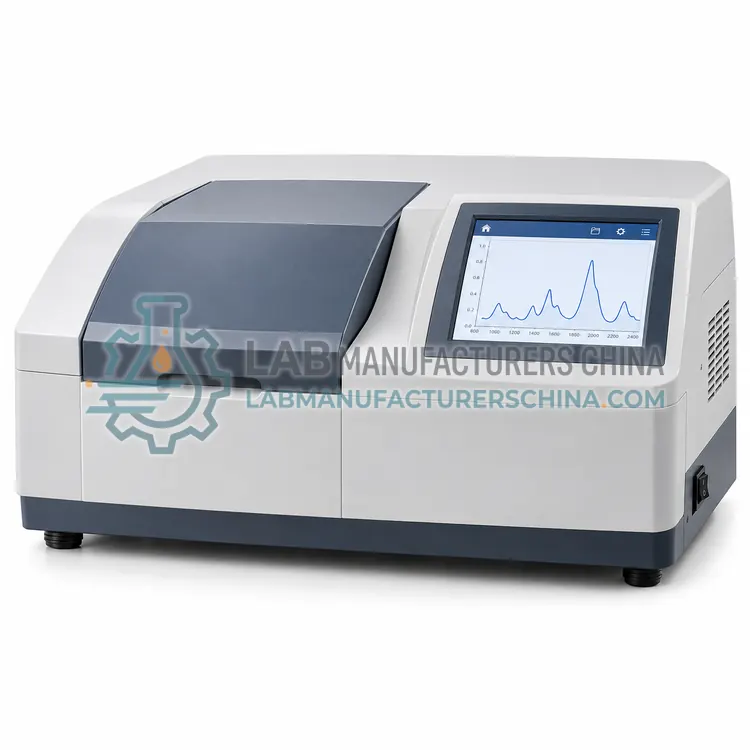
NIR Chemical Imaging System
近红外化学成像系统
- SKU NIR-0005
- NIR
- CE (to be confirmed)
- ISO 9001 manufacturing (to be confirmed)
- 21 CFR Part 11 software compliance (to be confirmed)
Price on request — FOB / CIF quoted per order
Prices depend on configuration, quantity and destination port.
Key specifications
| Spectral range | 1000–2500 nm |
|---|---|
| Spectral resolution | 5–10 nm |
| Spatial resolution | 10–200 µm |
| Field of view | up to 100 × 100 mm |
| Detector | InGaAs focal-plane array |
| Imaging mode | pushbroom line scan |
Request a quote Download brochure · to be provided
By Lab Manufacturers China Technical TeamLast reviewed Standards: Ph. Eur. 2.2.40 Near-infrared spectrophotometry, USP <1119> Near-Infrared Spectroscopy, ASTM E1655 Standard Practices for Infrared Multivariate Quantitative Analysis
What is the NIR Chemical Imaging System?
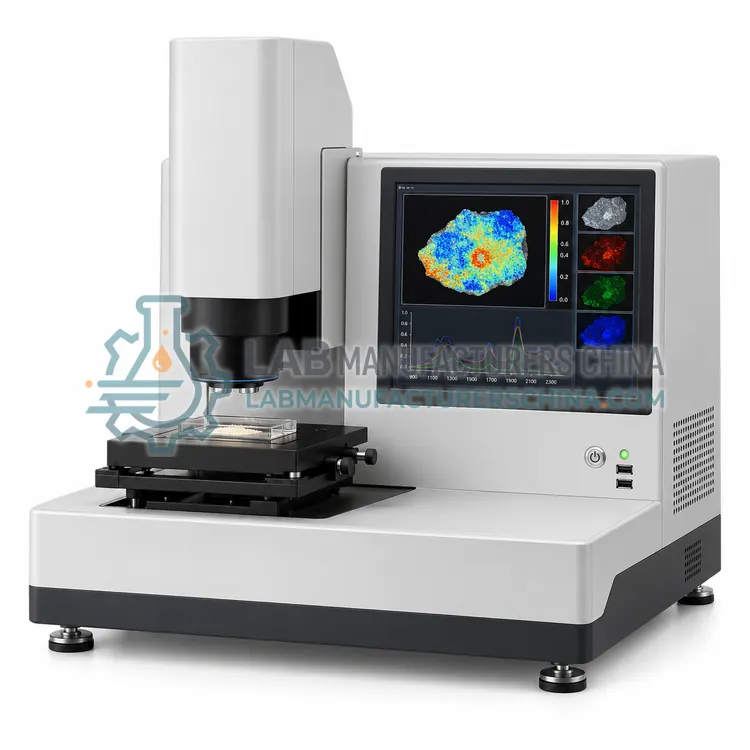
An NIR chemical imaging system captures a complete spectrum at every pixel of a sample surface. It is chosen to map ingredient distribution, detect minor components and investigate heterogeneity in tablets, powders and materials.
What is the NIR Chemical Imaging System?
An NIR chemical imaging system captures a complete spectrum at every pixel of a sample surface. It is chosen to map ingredient distribution, detect minor components and investigate heterogeneity in tablets, powders and materials.
Overview
This instrument combines a near-infrared spectrometer with an imaging detector, either by scanning a line across the sample with a pushbroom configuration or by acquiring a focal-plane array with a tunable filter. Each pixel becomes a spectrum, so a data cube links chemical information to spatial position. Common modalities are reflectance for solids and transflectance for powders, with spatial resolution from a few micrometres to hundreds of micrometres depending on optics and wavelength. Data analysis uses multivariate tools such as principal component analysis, partial least squares and multivariate curve resolution to create chemical maps, and morphological tools to identify particles and agglomerates. Applications range from tablet coating and blend uniformity to counterfeit detection, contamination analysis and homogeneity of powders. Throughput depends on detector size, line speed and the number of co-added scans.
How does it work?
Near-infrared spectroscopy probes overtones and combination bands of fundamental molecular vibrations, mainly of hydrogen-bearing groups such as O-H, N-H and C-H. Absorption in this region is weak, so light penetrates millimeters to centimeters into powders, grains and liquids, which allows bulk measurement with little sample preparation. Instruments use a polychromatic source and either a Fourier transform interferometer or a grating with a detector array to record reflectance, transmission or transflectance spectra. Because the bands are broad and overlapping, composition is predicted with multivariate calibration models built from a set of reference samples analyzed by a primary method such as Karl Fischer titration, Kjeldahl nitrogen or HPLC. Models use algorithms such as partial least squares regression and are validated for the specific product, instrument and measurement conditions.
What are the key features?
- Pushbroom or focal-plane array imaging detector
- Full spectrum recorded at every pixel
- Spatial resolution from micrometres to hundreds of micrometres
- Reflectance and transflectance measurement modes
- Multivariate mapping with principal components and PLS
- Particle and agglomerate analysis software
What are the technical specifications?
A typical nir chemical imaging system configuration offers spectral range of 1000–2500 nm, spectral resolution of 5–10 nm, spatial resolution of 10–200 µm, field of view of up to 100 × 100 mm, detector of InGaAs focal-plane array and imaging mode of pushbroom line scan. Values are indicative of the product class; the exact figures for each configuration are confirmed on the quotation and the calibration documents supplied with the instrument.
Which applications is it used for?
The NIR Chemical Imaging System is used in tablet coating thickness and uniformity mapping, blend and powder homogeneity studies, counterfeit and contamination investigation and composite and polymer material analysis. Across the wider NIR class, laboratories also deploy it for raw material identification at goods receipt, moisture, protein, fat and starch determination in food and feed and pharmaceutical blend uniformity and tablet content monitoring.
Which standards and certifications apply?
Relevant standards and methods include Ph. Eur. 2.2.40 Near-infrared spectrophotometry, USP <1119> Near-Infrared Spectroscopy, ASTM E1655 Standard Practices for Infrared Multivariate Quantitative Analysis, ISO 12099 Guidelines for the application of near infrared spectrometry, ICH Q2(R2) Validation of analytical procedures, ISO/IEC 17025 and IEC 61010-1. Certification candidates for this model are CE, ISO 9001 manufacturing and 21 CFR Part 11 software compliance; each is to be confirmed for the specific configuration before shipment, and certificates are supplied only where they have been issued.
Near-infrared results depend on representative sampling because the measurement volume is small relative to a batch. Sample presentation, particle size, packing density, temperature and moisture all shift spectra, so operators must follow a fixed procedure. Calibration models require ongoing maintenance: performance checks against reference samples, outlier detection, and updating when raw materials, processes or instruments change. Reference analyses must be accurate because model errors persist. Instruments should be qualified and models validated before use, with change control for software and calibration updates. Install units on stable benches or in the plant with protection from vibration, dust and temperature swings.
How do I select the right NIR Chemical Imaging System?
Select an imaging system when spatial distribution, not just average composition, is the question, for example coating uniformity, minor ingredient detection or contamination mapping. Define the required spatial and spectral resolution, sample size and whether measurement is transmission or reflectance. Confirm data analysis software supports the multivariate methods you need and that computing capacity matches the data cube size.
How does it compare with other NIR variants?
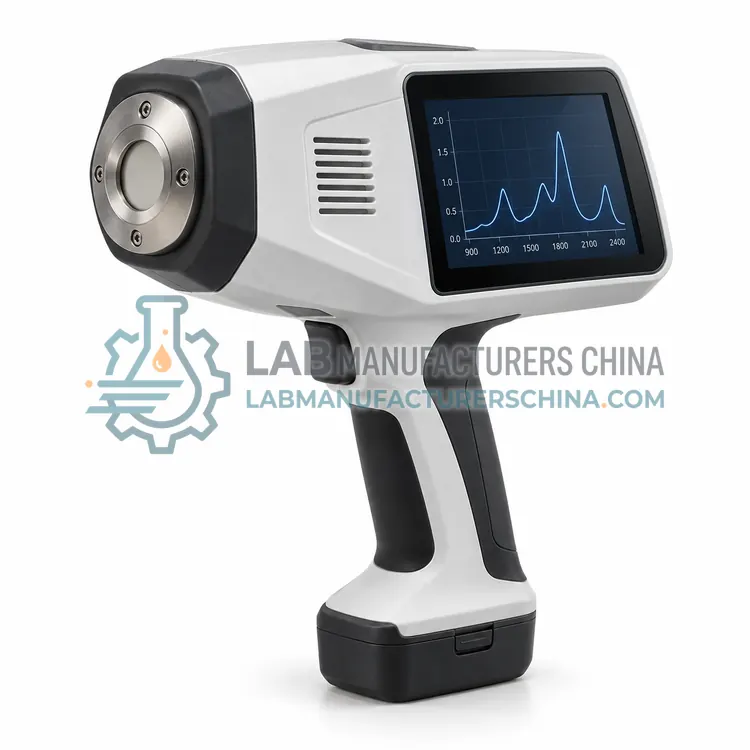
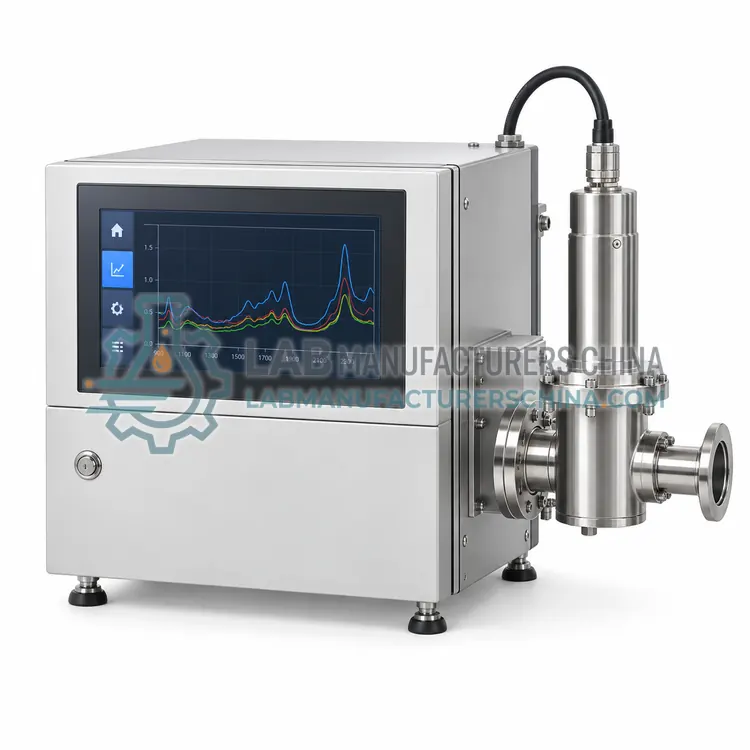
Choose a NIR system from the sample form and the regulatory context, because the calibration model is often more valuable than the hardware. Benchtop FT-NIR analyzers suit laboratories that need high resolution and stable performance for many product models. Dispersive grating instruments with array detectors are compact and fast for routine quality checks. Handheld analyzers serve incoming material identification and field work. Process analyzers with fiber-optic probes measure at the reactor, dryer or blender. Chemical imaging systems map heterogeneity. For every option, confirm that validated calibrations exist or can be developed, and check wavelength range, resolution, photometric stability and whether the instrument can transfer models from another site.
Full specifications
| Spectral range | 1000–2500 nm |
|---|---|
| Spectral resolution | 5–10 nm |
| Spatial resolution | 10–200 µm |
| Field of view | up to 100 × 100 mm |
| Detector | InGaAs focal-plane array |
| Imaging mode | pushbroom line scan |
| Data cube size | up to 320 × 256 pixels |
| Illumination | halogen line illuminator |
| Scan time | 10–120 s per image |
| Software | multivariate imaging and mapping |
Indicative values for this product class. Final specifications are confirmed on the quotation and in the calibration documents supplied with the instrument.
Applications
- Tablet coating thickness and uniformity mapping
- Blend and powder homogeneity studies
- Counterfeit and contamination investigation
- Composite and polymer material analysis
Key features
- Pushbroom or focal-plane array imaging detector
- Full spectrum recorded at every pixel
- Spatial resolution from micrometres to hundreds of micrometres
- Reflectance and transflectance measurement modes
- Multivariate mapping with principal components and PLS
- Particle and agglomerate analysis software
Frequently asked questions about NIR Chemical Imaging System
Mapping, or point mapping, measures one spectrum at a time while a stage moves the sample, which is slow but gives high spatial resolution. Imaging captures many pixels in parallel with a line or array detector, so it is much faster and suits larger areas at slightly lower resolution. The choice depends on area, resolution and analysis time.
Detection depends on particle size relative to the spatial resolution and on spectral contrast. Particles smaller than a pixel are diluted by surrounding material, so signals weaken. Sub-millimetre particles are often detectable when their spectra differ clearly, but trace-sized contamination may require microscopy or other techniques.
A single image can contain hundreds of thousands of spectra with thousands of wavelength points, producing files of hundreds of megabytes to several gigabytes. Processing requires appropriate computing power, storage and software. Many workflows reduce data with binning, region selection or principal component analysis before modeling to keep analysis practical.
FTIR measures fundamental vibrational absorptions in the mid-infrared from about 4000 to 400 cm-1, giving sharp characteristic bands for functional groups. NIR measures weak overtones and combination bands from about 12500 to 4000 cm-1, giving broad overlapping bands suited to quantitative models. FTIR identifies structure; NIR predicts composition in bulk samples.
Often yes, because models are specific to product, process and instrument. Vendors may supply starter or library models for common materials, but they still require validation and often adjustment with local samples. Plan time and reference laboratory capacity for model development, and budget for ongoing model maintenance as materials and processes change.
A robust quantitative model usually needs at least 50 to 100 representative samples spanning the expected variation, ideally more for wide ranges or multiple seasons. The samples must cover the full range of the analyte and matrix variation, and their reference values must be accurate. Model performance is judged on independent validation samples, not the calibration set.
Related models