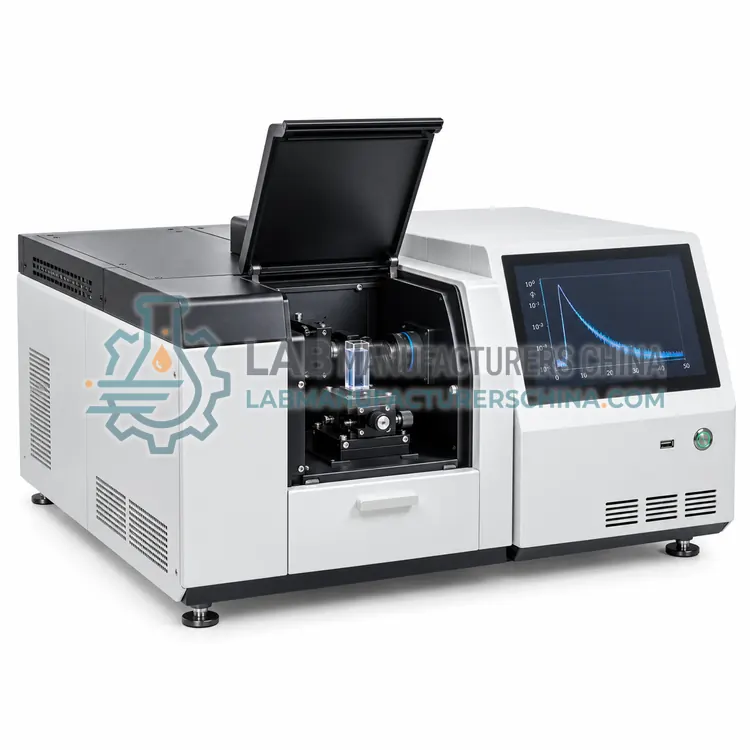
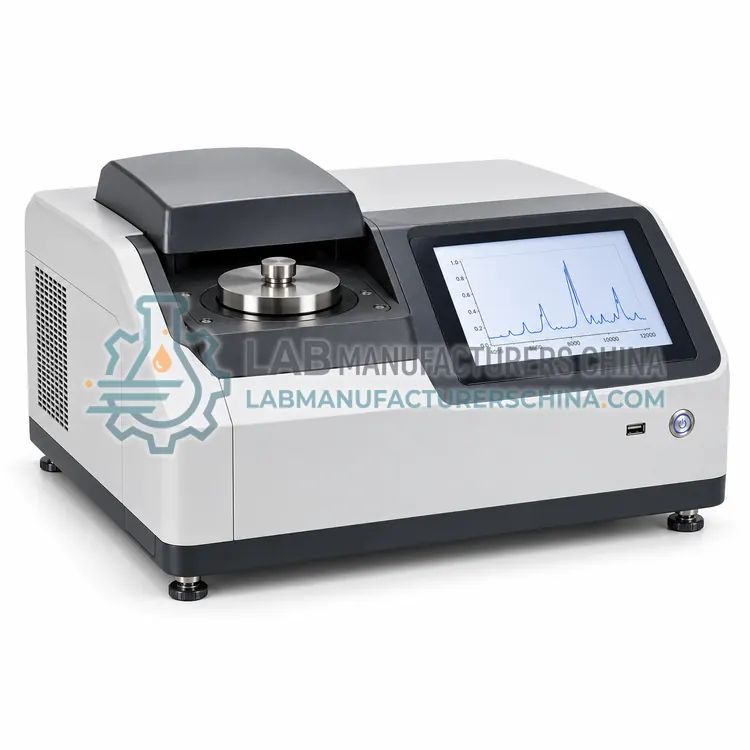
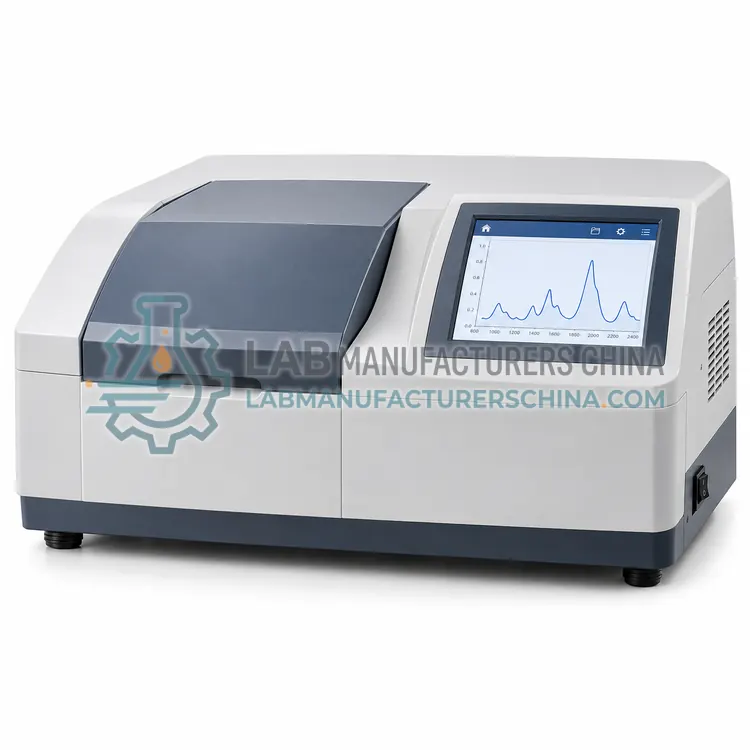
Dispersive Grating NIR Spectrophotometer
色散光栅近红外分光光度计
- SKU NIR-0002
- NIR
- CE (to be confirmed)
- ISO 9001 manufacturing (to be confirmed)
- IP65 enclosure option (to be confirmed)
Price on request — FOB / CIF quoted per order
Prices depend on configuration, quantity and destination port.
Key specifications
| Wavelength range | 900–1700 nm or 1100–2500 nm |
|---|---|
| Detector | linear InGaAs photodiode array |
| Spectral resolution | 5–10 nm |
| Wavelength accuracy | ±1 nm |
| Integration time | 1–100 ms |
| Light source | tungsten halogen, 20 W |
Request a quote Download brochure · to be provided
By Lab Manufacturers China Technical TeamLast reviewed Standards: Ph. Eur. 2.2.40 Near-infrared spectrophotometry, USP <1119> Near-Infrared Spectroscopy, ASTM E1655 Standard Practices for Infrared Multivariate Quantitative Analysis
What is the Dispersive Grating NIR Spectrophotometer?
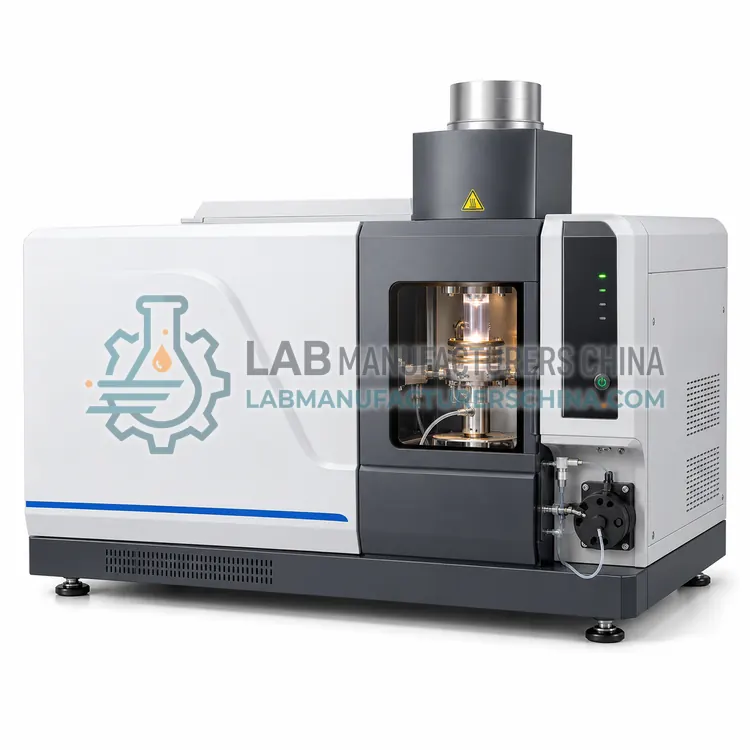
A dispersive grating NIR spectrophotometer uses a fixed grating and a detector array to capture near-infrared spectra quickly and without moving parts. It is chosen for compact, fast and rugged routine analysis and at-line quality checks.
What is the Dispersive Grating NIR Spectrophotometer?
A dispersive grating NIR spectrophotometer uses a fixed grating and a detector array to capture near-infrared spectra quickly and without moving parts. It is chosen for compact, fast and rugged routine analysis and at-line quality checks.
Overview
Instead of a moving interferometer, this instrument disperses broadband light from a tungsten halogen lamp across a fixed grating and images the spectrum onto a linear photodiode or InGaAs array. The absence of moving parts reduces wear and vibration sensitivity, and full spectra can be collected in milliseconds, which suits online and at-line use. A charge-coupled device or array readout gives simultaneous detection across the range, typically from 900 to 1700 nm or 1100 to 2500 nm depending on the array material. Resolution is generally lower than FT-NIR, often 5 to 10 nm, but is sufficient for many broad-band quantitative methods and identity checks. Fiber-optic probes, reflectance heads and transmission modules extend the platform to solids, slurries and liquids. Chemometric software supports library search, partial least squares models and trend logging.
How does it work?
Near-infrared spectroscopy probes overtones and combination bands of fundamental molecular vibrations, mainly of hydrogen-bearing groups such as O-H, N-H and C-H. Absorption in this region is weak, so light penetrates millimeters to centimeters into powders, grains and liquids, which allows bulk measurement with little sample preparation. Instruments use a polychromatic source and either a Fourier transform interferometer or a grating with a detector array to record reflectance, transmission or transflectance spectra. Because the bands are broad and overlapping, composition is predicted with multivariate calibration models built from a set of reference samples analyzed by a primary method such as Karl Fischer titration, Kjeldahl nitrogen or HPLC. Models use algorithms such as partial least squares regression and are validated for the specific product, instrument and measurement conditions.
What are the key features?
- Fixed grating with no moving optical parts
- Linear InGaAs or silicon array detector
- Full spectra in milliseconds for online use
- Fiber-optic probe, reflectance and transmission modules
- Compact and vibration-tolerant for at-line installation
- Library search and partial least squares software
What are the technical specifications?
A typical dispersive grating nir spectrophotometer configuration offers wavelength range of 900–1700 nm or 1100–2500 nm, detector of linear InGaAs photodiode array, spectral resolution of 5–10 nm, wavelength accuracy of ±1 nm, integration time of 1–100 ms and light source of tungsten halogen, 20 W. Values are indicative of the product class; the exact figures for each configuration are confirmed on the quotation and the calibration documents supplied with the instrument.
Which applications is it used for?
The Dispersive Grating NIR Spectrophotometer is used in at-line identity and composition checks, continuous process monitoring with probes, agricultural grain and food screening and petrochemical and polymer property prediction. Across the wider NIR class, laboratories also deploy it for raw material identification at goods receipt, moisture, protein, fat and starch determination in food and feed and pharmaceutical blend uniformity and tablet content monitoring.
Which standards and certifications apply?
Relevant standards and methods include Ph. Eur. 2.2.40 Near-infrared spectrophotometry, USP <1119> Near-Infrared Spectroscopy, ASTM E1655 Standard Practices for Infrared Multivariate Quantitative Analysis, ISO 12099 Guidelines for the application of near infrared spectrometry, ICH Q2(R2) Validation of analytical procedures, ISO/IEC 17025 and IEC 61010-1. Certification candidates for this model are CE, ISO 9001 manufacturing and IP65 enclosure option; each is to be confirmed for the specific configuration before shipment, and certificates are supplied only where they have been issued.
Near-infrared results depend on representative sampling because the measurement volume is small relative to a batch. Sample presentation, particle size, packing density, temperature and moisture all shift spectra, so operators must follow a fixed procedure. Calibration models require ongoing maintenance: performance checks against reference samples, outlier detection, and updating when raw materials, processes or instruments change. Reference analyses must be accurate because model errors persist. Instruments should be qualified and models validated before use, with change control for software and calibration updates. Install units on stable benches or in the plant with protection from vibration, dust and temperature swings.
How do I select the right Dispersive Grating NIR Spectrophotometer?
Select a dispersive grating instrument when speed, compact size or immunity to vibration matter more than the highest spectral resolution, for example at-line or online process use. Confirm the wavelength range covers the analyte bands, that the array is suitable for your sample temperatures, and that validated models can be transferred. Check stray-light performance and thermal stability if the unit is installed in a plant.
How does it compare with other NIR variants?
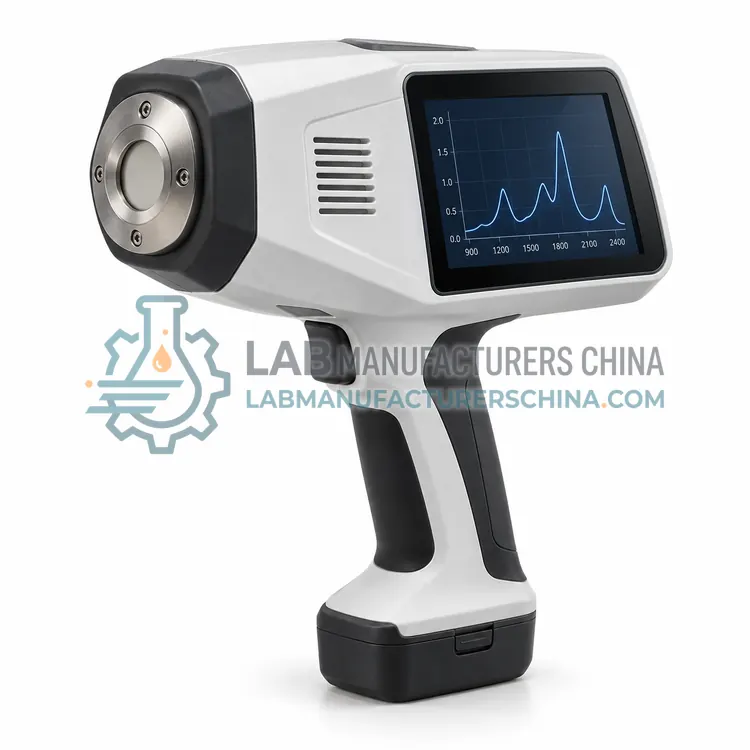
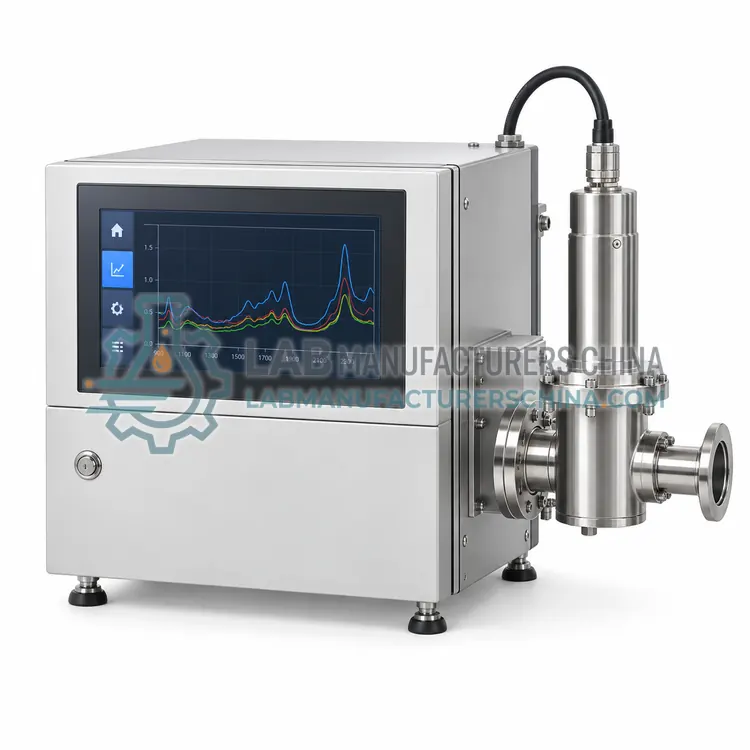
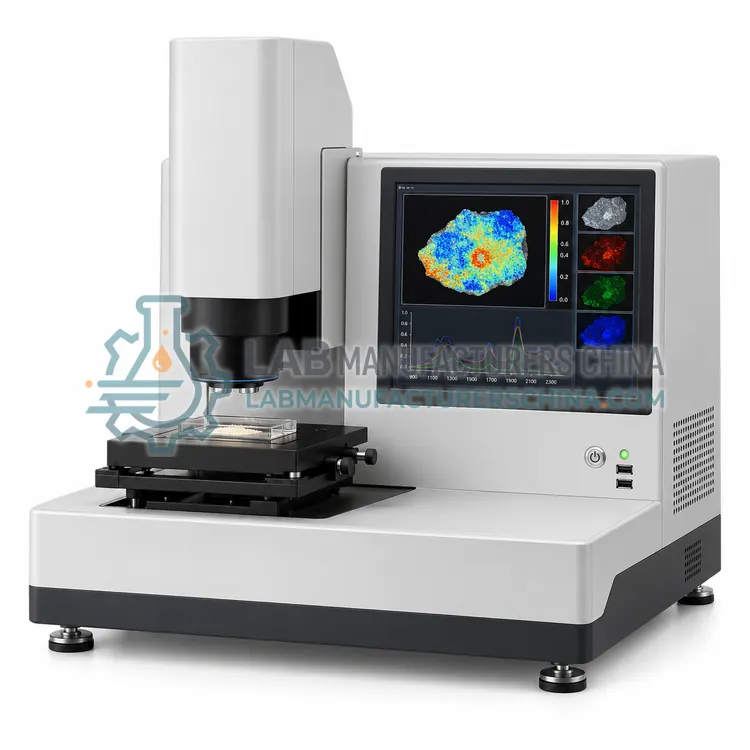
Choose a NIR system from the sample form and the regulatory context, because the calibration model is often more valuable than the hardware. Benchtop FT-NIR analyzers suit laboratories that need high resolution and stable performance for many product models. Dispersive grating instruments with array detectors are compact and fast for routine quality checks. Handheld analyzers serve incoming material identification and field work. Process analyzers with fiber-optic probes measure at the reactor, dryer or blender. Chemical imaging systems map heterogeneity. For every option, confirm that validated calibrations exist or can be developed, and check wavelength range, resolution, photometric stability and whether the instrument can transfer models from another site.
Full specifications
| Wavelength range | 900–1700 nm or 1100–2500 nm |
|---|---|
| Detector | linear InGaAs photodiode array |
| Spectral resolution | 5–10 nm |
| Wavelength accuracy | ±1 nm |
| Integration time | 1–100 ms |
| Light source | tungsten halogen, 20 W |
| Signal-to-noise | ≥ 3000:1 |
| Photometric range | 0–3 AU |
| Operating temperature | 5–40 °C |
| Communication | USB / Ethernet |
Indicative values for this product class. Final specifications are confirmed on the quotation and in the calibration documents supplied with the instrument.
Applications
- At-line identity and composition checks
- Continuous process monitoring with probes
- Agricultural grain and food screening
- Petrochemical and polymer property prediction
Key features
- Fixed grating with no moving optical parts
- Linear InGaAs or silicon array detector
- Full spectra in milliseconds for online use
- Fiber-optic probe, reflectance and transmission modules
- Compact and vibration-tolerant for at-line installation
- Library search and partial least squares software
Frequently asked questions about Dispersive Grating NIR Spectrophotometer
For many routine quantitative methods the prediction accuracy is comparable when a good calibration model is used, because the broad NIR bands tolerate modest resolution. FT-NIR generally wins on wavelength precision, resolution and model transfer. Choose FT-NIR for method development and cross-site transfer and dispersive for fast routine or process use.
Array detectors capture the whole spectrum at once without moving parts, so measurement is fast and mechanically robust. That allows hundreds of spectra per second for averaging and real-time process control, and reduces the risk of a moving mirror or grating failing in a plant environment.
Sensitivity is limited by detector noise, stray light, lamp output and the short integration times used for speed. In the 1100 to 2500 nm region the InGaAs and extended detectors become noisier, and water absorption can dominate. Averaging multiple scans and controlling sample temperature improve repeatability.
FTIR measures fundamental vibrational absorptions in the mid-infrared from about 4000 to 400 cm-1, giving sharp characteristic bands for functional groups. NIR measures weak overtones and combination bands from about 12500 to 4000 cm-1, giving broad overlapping bands suited to quantitative models. FTIR identifies structure; NIR predicts composition in bulk samples.
Often yes, because models are specific to product, process and instrument. Vendors may supply starter or library models for common materials, but they still require validation and often adjustment with local samples. Plan time and reference laboratory capacity for model development, and budget for ongoing model maintenance as materials and processes change.
A robust quantitative model usually needs at least 50 to 100 representative samples spanning the expected variation, ideally more for wide ranges or multiple seasons. The samples must cover the full range of the analyte and matrix variation, and their reference values must be accurate. Model performance is judged on independent validation samples, not the calibration set.