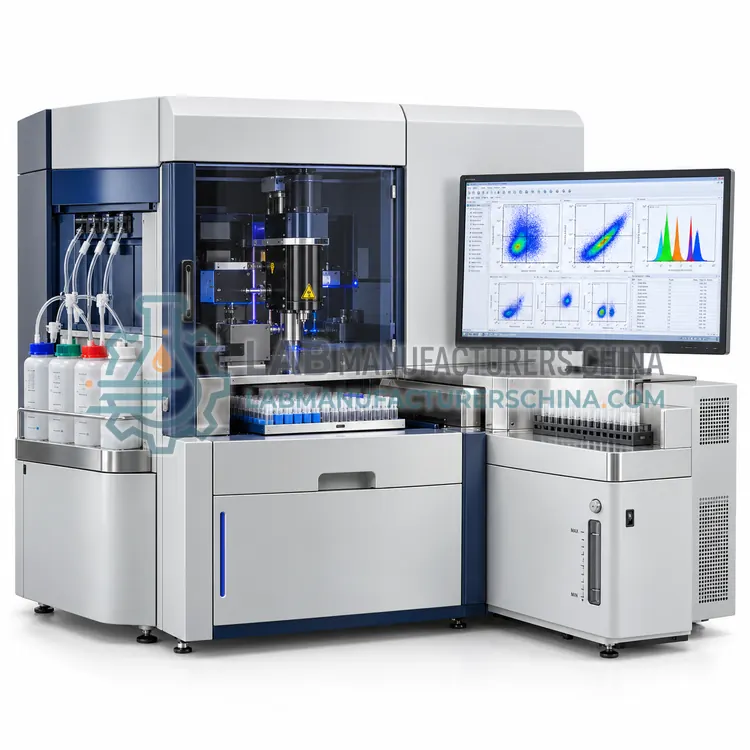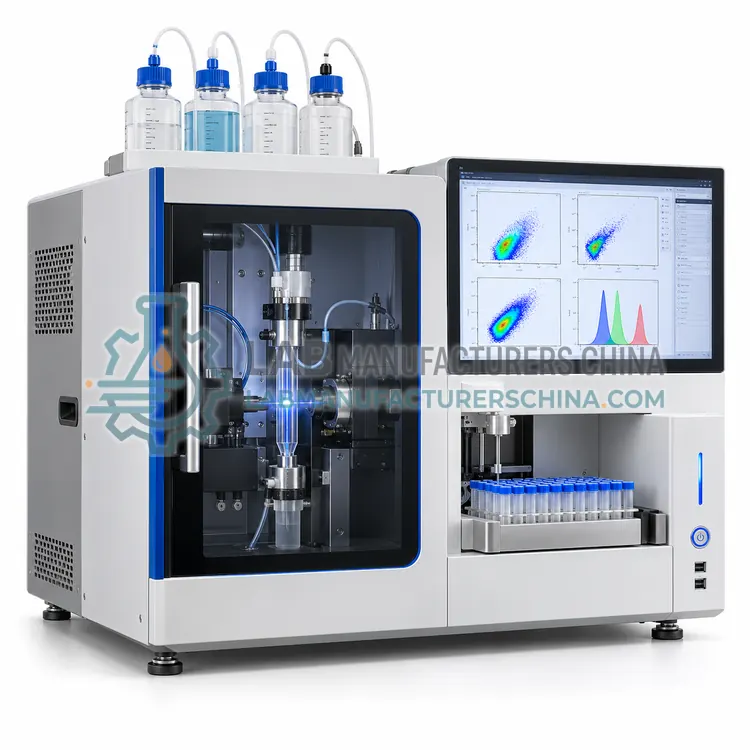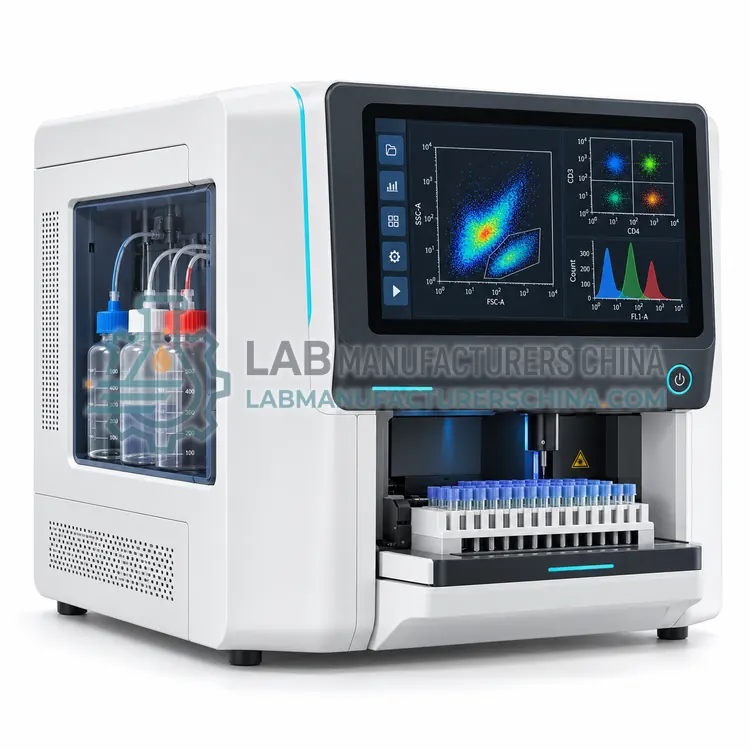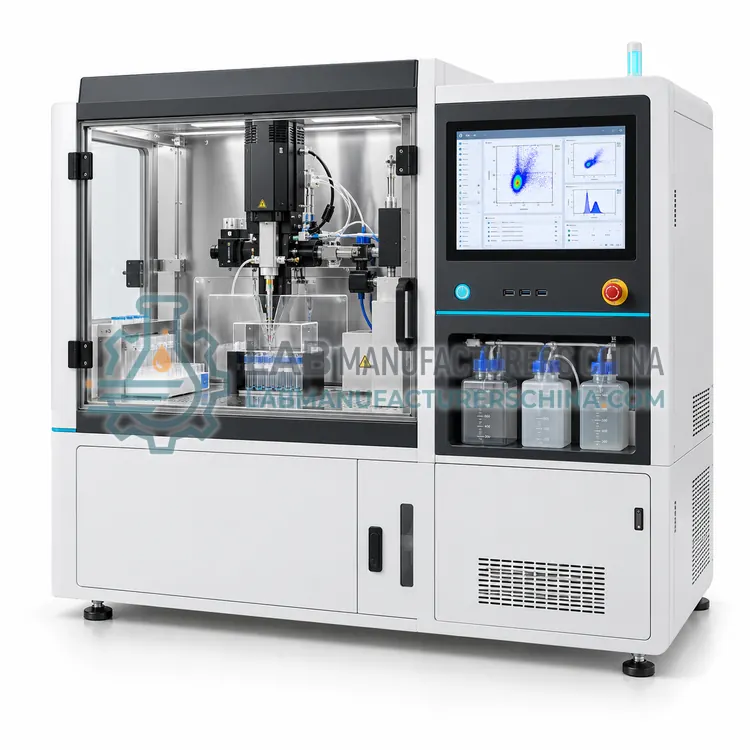
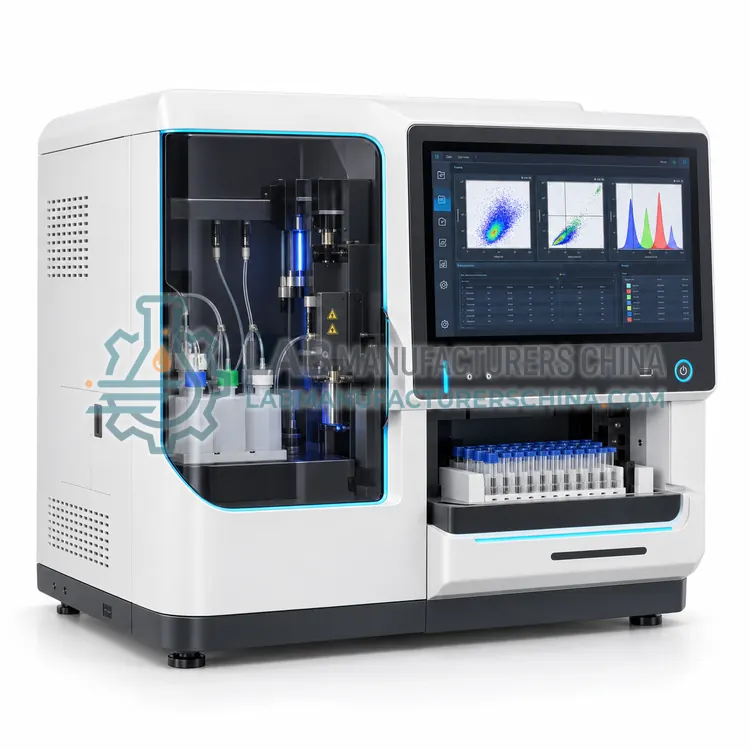
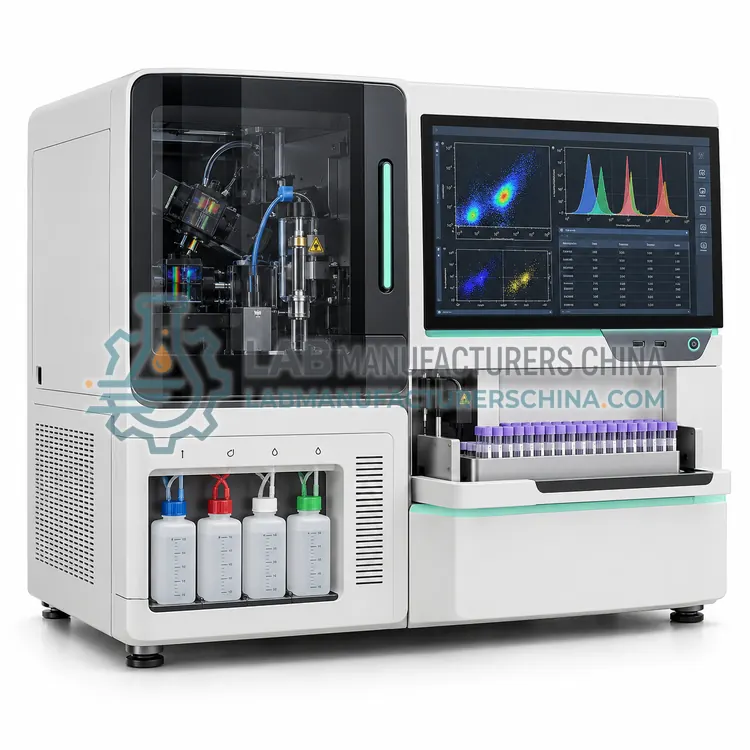
Spectral Flow Cytometer
光谱流式细胞仪
- SKU FCY-0003
- Flow Cytometers
- CE (to be confirmed)
- IEC 61010-1 compliance (to be confirmed)
- ISO 9001 manufacturing (to be confirmed)
Price on request — FOB / CIF quoted per order
Prices depend on configuration, quantity and destination port.
Key specifications
| Spectral detection range | Approx. 350–900 nm |
|---|---|
| Detection channels | 32–64+ |
| Laser configuration | 3–5 (355/405/488/561/640 nm) |
| Maximum event rate | Up to 35,000 events/s |
| Validated panel size | Up to 40 colors (typical claim) |
| Detector type | APD or PMT array |
Request a quote Download brochure · to be provided
By Lab Manufacturers China Technical TeamLast reviewed Standards: CLSI H62, CLSI H43, ISO 20391-1
What is the Spectral Flow Cytometer?
A spectral flow cytometer records the full fluorescence emission spectrum of every cell across an array of detectors and mathematically unmixes overlapping dyes. It allows larger panels with fewer optical constraints and can subtract cellular autofluorescence, which suits deep phenotyping of autofluorescent samples.
What is the Spectral Flow Cytometer?
A spectral flow cytometer records the full fluorescence emission spectrum of every cell across an array of detectors and mathematically unmixes overlapping dyes. It allows larger panels with fewer optical constraints and can subtract cellular autofluorescence, which suits deep phenotyping of autofluorescent samples.
Overview
Spectral cytometers replace discrete filter-and-detector pairs with prisms, gratings or large detector arrays that capture emission from roughly 350 to 900 nm in 32 to 64 or more channels. Each fluorochrome has a reference spectral signature, collected from single-stained controls, and least-squares or weighted algorithms unmix the mixed signal in every event. This makes it possible to use dyes whose peaks are close together, to subtract an autofluorescence signature from macrophages, tumor cells or tissue digests, and to reuse a fixed optical configuration for any panel without changing filters. Systems typically carry three to five lasers and support event rates of 20,000 to 35,000 events per second. Accurate single-stain controls with matching brightness and treatment are essential, and unmixing accuracy depends on control quality.
How does it work?
A flow cytometer uses sheath fluid to hydrodynamically focus a sample into a narrow core stream so cells cross the laser interrogation point one at a time. Scattered light is collected at small angles (forward scatter, related to size) and at 90 degrees (side scatter, related to granularity). Fluorochromes are excited by lasers, commonly 405, 488, 561 and 640 nm, and emission is split by dichroic filters and bandpass filters to photomultiplier tubes or photodiodes. Conventional instruments assign one detector per fluorochrome and apply a compensation matrix, whereas spectral instruments capture the full emission spectrum and unmix it mathematically. Electronics digitize pulse height, area and width, and software records list-mode FCS files for gating and statistical analysis.
What are the key features?
- Full-spectrum detection across roughly 350 to 900 nm in 32 to 64 channels
- Unmixing algorithm separates dyes with closely overlapping emission peaks
- Autofluorescence extraction improves resolution in macrophage, tumor and tissue samples
- Fixed optical layout removes the need for filter changes between panels
- Three to five lasers with spatially separated beam spots
- Reference spectrum library supports reuse of single-stain controls between runs
What are the technical specifications?
A typical spectral flow cytometer configuration offers spectral detection range of Approx. 350–900 nm, detection channels of 32–64+, laser configuration of 3–5 (355/405/488/561/640 nm), maximum event rate of Up to 35,000 events/s, validated panel size of Up to 40 colors (typical claim) and detector type of APD or PMT array. Values are indicative of the product class; the exact figures for each configuration are confirmed on the quotation and the calibration documents supplied with the instrument.
Which applications is it used for?
The Spectral Flow Cytometer is used in deep immune profiling with 30+ markers, autofluorescent tissue digest analysis, tumor microenvironment phenotyping, panel design with similar-emission dyes and biobank and clinical trial immune monitoring. Across the wider Flow Cytometers class, laboratories also deploy it for immunophenotyping of lymphocyte subsets, CD34 stem cell enumeration and cell cycle and apoptosis analysis.
Which standards and certifications apply?
Relevant standards and methods include CLSI H62, CLSI H43, ISO 20391-1, IEC 61010-1, IEC 61010-2-101, IEC 60825-1 and ISAC FCS 3.1. Certification candidates for this model are CE, IEC 61010-1 compliance and ISO 9001 manufacturing; each is to be confirmed for the specific configuration before shipment, and certificates are supplied only where they have been issued.
Install the cytometer on a vibration-free bench with stable power and ambient temperature between 15 and 30 degrees Celsius, and provide waste handling for potentially biohazardous effluent, typically with bleach treatment. Run daily quality control using fluorescent beads to verify laser alignment, sensitivity and coefficient of variation, and keep Levey-Jennings style records of detector voltages. Perform daily and weekly fluidics cleaning to avoid clogging, and replace sheath filters and tubing on schedule. Laser power and optical alignment should be checked by trained service staff at least annually. Laboratories working under ISO 15189 or GLP should enable audit trails, electronic signatures and validated software updates.
How do I select the right Spectral Flow Cytometer?
Choose spectral detection when you need 20 or more colors, work with autofluorescent cell types, or want panels to be reconfigured without optical changes. It demands good single-stain controls and unmixing expertise. In an RFQ specify channel count, laser set, unmixing software features, autofluorescence extraction and compatibility with existing FCS analysis tools.
How does it compare with other Flow Cytometers variants?
Select a cytometer by panel complexity, sensitivity and workflow. Define the maximum number of simultaneous colors, then choose laser and detector count to match; conventional filter-based systems are simple for 4 to 12 colors, while spectral systems ease panel design beyond 20. Check resolution of dim populations, small particle detection and event rate, typically 10,000 to 100,000 events per second. Consider footprint, whether a compact personal analyzer or a full research platform is required, and whether an acoustic focusing or plate loader is needed for throughput. Verify that software provides compensation or unmixing, batch analysis and user access control. For clinical use, confirm that the supplier can support IVD documentation, calibration beads and a validated quality control routine.
Full specifications
| Spectral detection range | Approx. 350–900 nm |
|---|---|
| Detection channels | 32–64+ |
| Laser configuration | 3–5 (355/405/488/561/640 nm) |
| Maximum event rate | Up to 35,000 events/s |
| Validated panel size | Up to 40 colors (typical claim) |
| Detector type | APD or PMT array |
| Dynamic range | Approx. 7 logs |
| Unmixing method | Least squares / weighted least squares |
| Sample flow rate | 10–100 µL/min |
| Data format | FCS 3.2 |
Indicative values for this product class. Final specifications are confirmed on the quotation and in the calibration documents supplied with the instrument.
Applications
- Deep immune profiling with 30+ markers
- Autofluorescent tissue digest analysis
- Tumor microenvironment phenotyping
- Panel design with similar-emission dyes
- Biobank and clinical trial immune monitoring
Key features
- Full-spectrum detection across roughly 350 to 900 nm in 32 to 64 channels
- Unmixing algorithm separates dyes with closely overlapping emission peaks
- Autofluorescence extraction improves resolution in macrophage, tumor and tissue samples
- Fixed optical layout removes the need for filter changes between panels
- Three to five lasers with spatially separated beam spots
- Reference spectrum library supports reuse of single-stain controls between runs
Frequently asked questions about Spectral Flow Cytometer
Spectral unmixing is a mathematical method that separates the contribution of each fluorochrome from the full emission spectrum measured for every cell. It uses reference spectra from single-stained controls and least-squares fitting, replacing the filter selection and compensation of conventional cytometry.
Yes. Accurate single-stain controls are essential because unmixing relies on clean reference spectra. Controls should use the same fluorochrome, cell type or bead, fixation and acquisition settings as the experimental sample to avoid unmixing errors.
Yes, an autofluorescence spectrum from an unstained sample can be treated as an extra fluorochrome and subtracted during unmixing. This improves resolution of dim markers in macrophages, tumor cells and tissue digests, although very bright autofluorescence can still add noise.
A flow cytometer measures forward scatter, side scatter and fluorescence intensity from each cell or particle. These signals report relative size, internal complexity and the presence or amount of fluorescently labeled markers, enabling counting, phenotyping and functional analysis at rates of thousands of cells per second.
Conventional cytometers use optical filters to direct a defined wavelength band to each detector and then compensate for overlap. Spectral cytometers record the whole emission spectrum across many detectors and unmix it, which allows more colors per panel and use of autofluorescence extraction.
Run quality control with fluorescent calibration beads every day of use to confirm laser alignment, sensitivity and stability. Full preventive maintenance by a trained engineer, including laser power and optical alignment verification, is normally performed once or twice a year.
Related models