
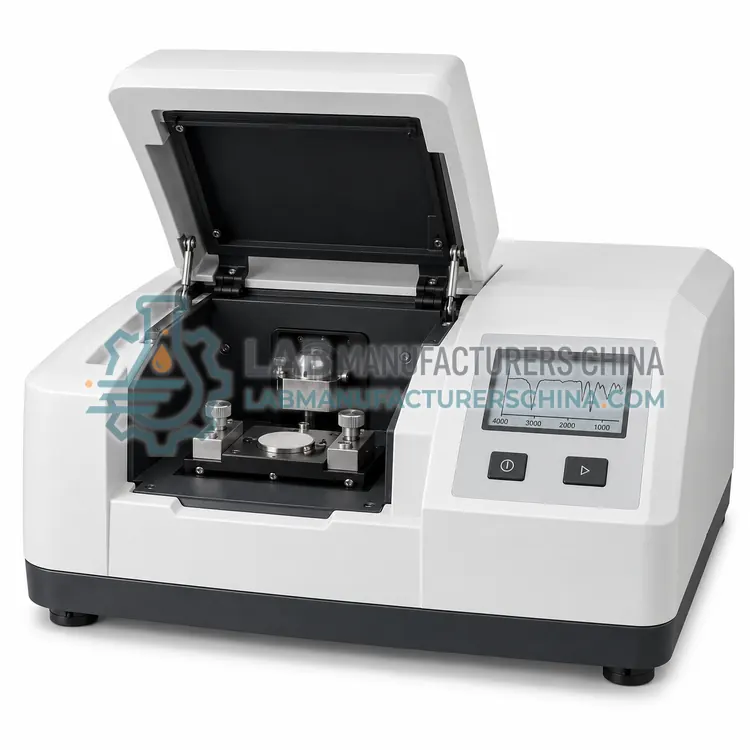
FTIR Spectrometer for Plastic Composition Analysis
塑料组成分析用红外光谱仪
- SKU PCA-0004
- Plastic Composition Analysis
- CE (to be confirmed)
- ISO 9001 manufacturing (to be confirmed)
Price on request — FOB / CIF quoted per order
Prices depend on configuration, quantity and destination port.
Key specifications
| Spectral range | 4000–400 cm⁻¹ |
|---|---|
| Resolution | 1–4 cm⁻¹ |
| Signal-to-noise ratio | Better than 20,000:1 at 4 cm⁻¹ |
| ATR crystal | Diamond, single reflection |
| Sampling depth | About 2 µm at 1000 cm⁻¹ |
| Detector | DLATGS with KBr window |
Request a quote Download brochure · to be provided
By Lab Manufacturers China Technical TeamLast reviewed Standards: ISO 3451-1, ASTM D5630, ASTM D1603
What is the FTIR Spectrometer for Plastic Composition Analysis?
An FTIR spectrometer identifies the polymer and detects additives, fillers and oxidation products from their infrared absorption bands. It is the fastest way to establish what a plastic part is made of and whether it has degraded.
What is the FTIR Spectrometer for Plastic Composition Analysis?
An FTIR spectrometer identifies the polymer and detects additives, fillers and oxidation products from their infrared absorption bands. It is the fastest way to establish what a plastic part is made of and whether it has degraded.
Overview
The spectrometer records mid-infrared absorption between 4000 and 400 cm⁻¹, and the fingerprint region below 1500 cm⁻¹ is compared with reference libraries to identify the polymer. Additives appear as additional bands, such as carbonate and sulfate absorptions from mineral fillers, ester carbonyls from plasticisers, or phosphorus and halogen bands from flame retardants, and the carbonyl index tracks oxidative degradation. Sampling is usually by attenuated total reflection for solid parts, with transmission through pressed films or KBr pellets where the strongest bands must be resolved. Where the composition of a specific particle matters, the spectrometer is coupled to a microscope. Sensitivity for minor additives is limited, and a separate chromatographic technique may be required for identification below a few tenths of a percent.
How does it work?
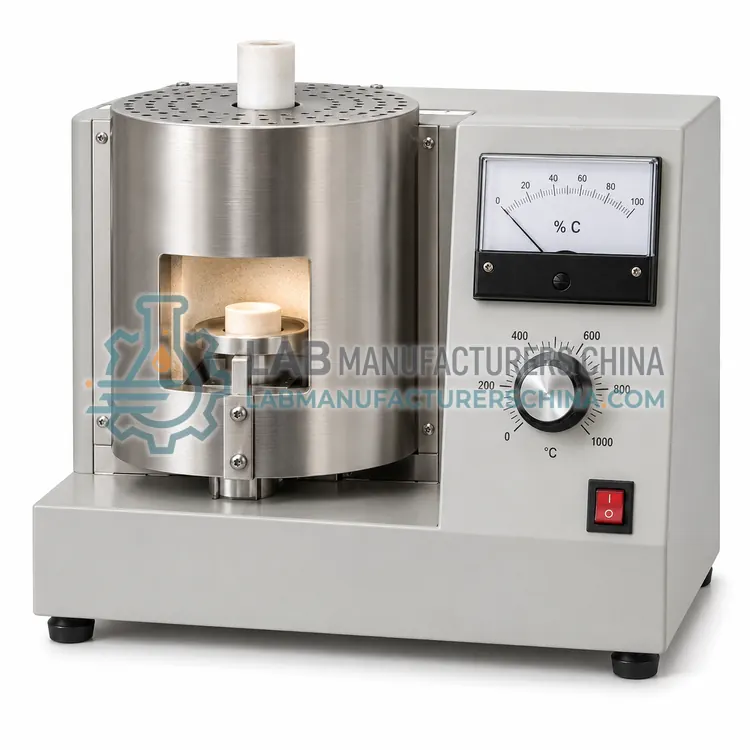
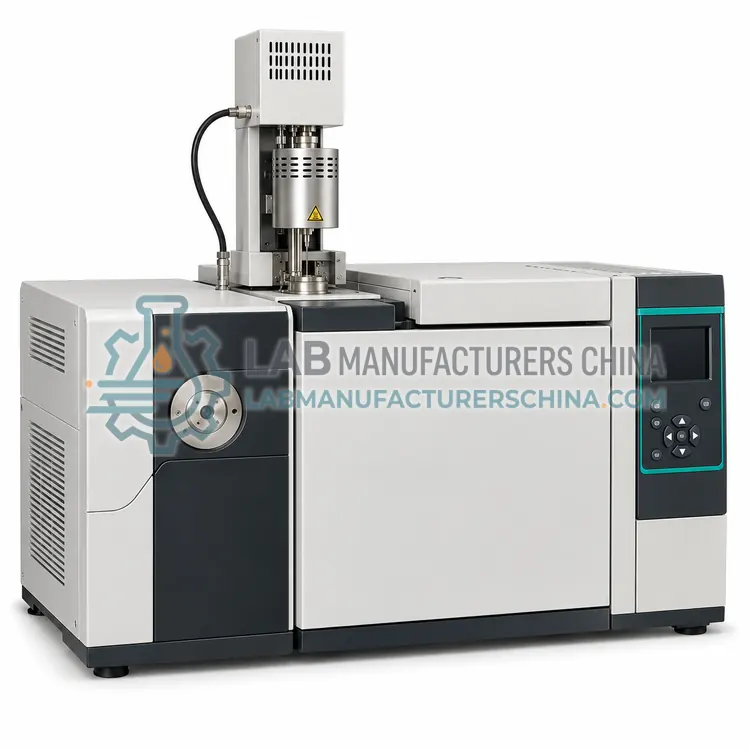
Different questions require different physical principles. Ashing and combustion methods remove the organic matrix by heating in air or oxygen, leaving the inorganic filler or ash as a residue that is weighed, which quantifies mineral content and glass fibre. Carbon black is measured by pyrolysing the polymer in nitrogen and then burning the carbon in oxygen. Infrared spectrometry identifies the polymer and detects functional-group changes caused by oxidation or additives. X-ray fluorescence excites the sample with X-rays and records the emitted characteristic radiation, giving rapid elemental screening for restricted substances. Pyrolysis gas chromatography with mass spectrometry thermally fragments the polymer in an inert atmosphere and separates the fragments, which identifies copolymers, plasticisers and additives that spectroscopy alone cannot resolve.
What are the key features?
- Spectral range of 4000–400 cm⁻¹
- Resolution selectable from 0.5 to 4 cm⁻¹
- Diamond ATR sampling for solid parts
- Library search for polymer identification
- Carbonyl index evaluation for degradation
- Minimal sample preparation requirement
What are the technical specifications?
A typical ftir spectrometer for plastic composition analysis configuration offers spectral range of 4000–400 cm⁻¹, resolution of 1–4 cm⁻¹, signal-to-noise ratio of Better than 20,000:1 at 4 cm⁻¹, ATR crystal of Diamond, single reflection, sampling depth of About 2 µm at 1000 cm⁻¹ and detector of DLATGS with KBr window. Values are indicative of the product class; the exact figures for each configuration are confirmed on the quotation and the calibration documents supplied with the instrument.
Which applications is it used for?
The FTIR Spectrometer for Plastic Composition Analysis is used in incoming polymer identification, filler and additive band detection, oxidative degradation assessment and comparison of a failed part with a reference. Across the wider Plastic Composition Analysis class, laboratories also deploy it for filler and glass fibre content determination, carbon black content in pipe and cable compounds and polymer identification in incoming inspection.
Which standards and certifications apply?
Relevant standards and methods include ISO 3451-1, ASTM D5630, ASTM D1603, ASTM E1131, ASTM D5576, ASTM D3452, ASTM F2617 and IEC 61010-1. Certification candidates for this model are CE and ISO 9001 manufacturing; each is to be confirmed for the specific configuration before shipment, and certificates are supplied only where they have been issued.
Representative sampling matters more than instrument precision, because fillers and additives are rarely distributed perfectly evenly. Grind or cryo-mill specimens, or take several portions from different locations, and record the sampling plan. Control the ashing temperature and time exactly, since mineral fillers may lose mass at high temperature and glass fibre can sinter. Keep crucibles clean and run a blank. For X-ray fluorescence, check the measurement area against the sample size and confirm whether the result reflects the surface layer only. Calibrate all equipment with certified reference materials and retain the raw data with the report.
How do I select the right FTIR Spectrometer for Plastic Composition Analysis?
Select infrared spectroscopy as the first composition method in almost every case, because it is fast, largely non-destructive and requires almost no preparation. Confirm that the library covers your polymer families and add a microscope if single particles need identification. Where an additive must be quantified or identified below the detection limit, plan for a chromatographic confirmation.
How does it compare with other Plastic Composition Analysis variants?
Choose by the question and the number of samples. Filler or glass content is measured by ashing in a muffle furnace or by thermogravimetry, and carbon black by a dedicated tube furnace with controlled atmospheres. Polymer identification is fastest by infrared, while X-ray fluorescence gives the quickest elemental screen for compliance work and can be used on a whole part without preparation. Pyrolysis gas chromatography is reserved for cases where the polymer or additive must be identified rather than quantified quickly, for example in a competitor product study or in a contamination investigation. For surface-specific questions such as filler dispersion or the composition of a single particle, microscopy with elemental analysis is added.
Full specifications
| Spectral range | 4000–400 cm⁻¹ |
|---|---|
| Resolution | 1–4 cm⁻¹ |
| Signal-to-noise ratio | Better than 20,000:1 at 4 cm⁻¹ |
| ATR crystal | Diamond, single reflection |
| Sampling depth | About 2 µm at 1000 cm⁻¹ |
| Detector | DLATGS with KBr window |
| Library capacity | Thousands of polymer and additive spectra |
| Purge requirement | Desiccant or dry air purge |
| Power supply | 220 V, 50/60 Hz |
Indicative values for this product class. Final specifications are confirmed on the quotation and in the calibration documents supplied with the instrument.
Applications
- Incoming polymer identification
- Filler and additive band detection
- Oxidative degradation assessment
- Comparison of a failed part with a reference
Key features
- Spectral range of 4000–400 cm⁻¹
- Resolution selectable from 0.5 to 4 cm⁻¹
- Diamond ATR sampling for solid parts
- Library search for polymer identification
- Carbonyl index evaluation for degradation
- Minimal sample preparation requirement
Frequently asked questions about FTIR Spectrometer for Plastic Composition Analysis
It can indicate the class of filler through characteristic bands. Calcium carbonate shows a strong carbonate absorption near 1420 and 875 cm⁻¹, talc shows silicate bands, and sulfates and titanium dioxide have their own signatures. Confirmation and quantification normally require ashing or elemental analysis.
It indicates oxidation, because carbonyl groups form when polymer chains react with oxygen during processing or weathering. The carbonyl index, the ratio of this band to a backbone reference band, is used to compare degradation between samples, and a clear increase normally corresponds to reduced mechanical performance.
ATR samples only one or two micrometres of the surface, so mould release agents, surface oxidation, migration of additives and skin layers dominate the spectrum, while transmission through a film averages the whole thickness. A disagreement between the two is itself informative about surface effects.
A weighed specimen is ashed at 625 °C under the conditions of ISO 3451-1, and the residue is weighed as total filler. For glass content alone, the ash is further treated by acid digestion or ignition at higher temperature to remove mineral fillers, and the remaining glass is weighed. Cryo-milling improves repeatability.
Carbon black burns away at ashing temperatures, so it is not included in the ash residue, and it is a separately specified additive in cable, pipe and geosynthetic compounds. It is determined by pyrolysing the polymer under nitrogen and then oxidising the carbon, so the mass loss in the oxidising stage gives the carbon black content.
Infrared identifies the main polymer and shows additive bands, but it cannot easily separate chemically similar additives or distinguish a copolymer composition in detail. Pyrolysis gas chromatography with mass spectrometry separates the fragments, so plasticisers, stabilisers, flame retardants and comonomer ratios can be identified even in a complex compound.
Related models